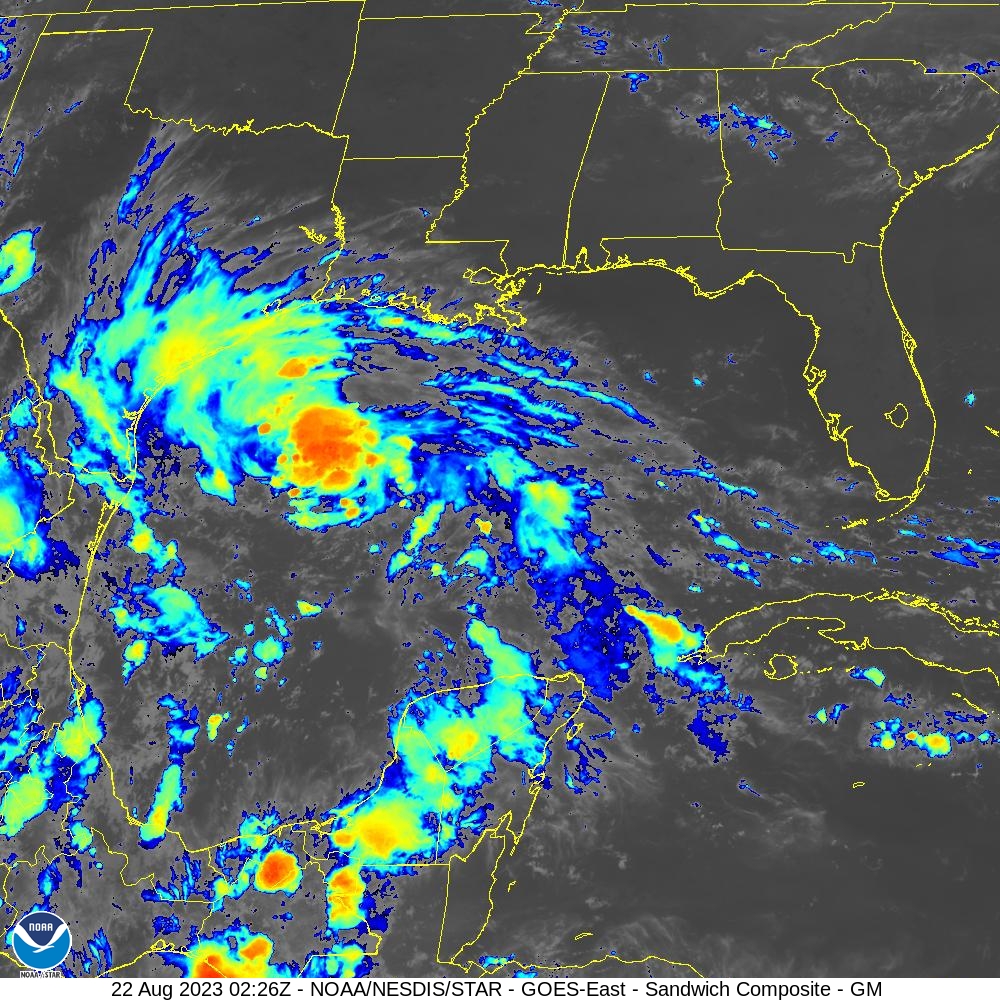
The Atlantic has heated up after it was dormant. Emily, Franklin, and Gert have formed. Only Franklin remains, but is out in the Caribbean. This brings us to Tropical Depression 9 or future Harold. Interestingly, Harold replaces Harvey, which ravaged Texas with heavy rain and flooding in 2017. I do not think this will be a repeat of Harvey by any stretch. Tropical Depression 9 is a tropical depression as of 10:00 PM CDT per National Hurricane Center. It has been hot and dry in Texas, so any rain is welcome. That leads to the question, where does Tropical Depression 9 go?
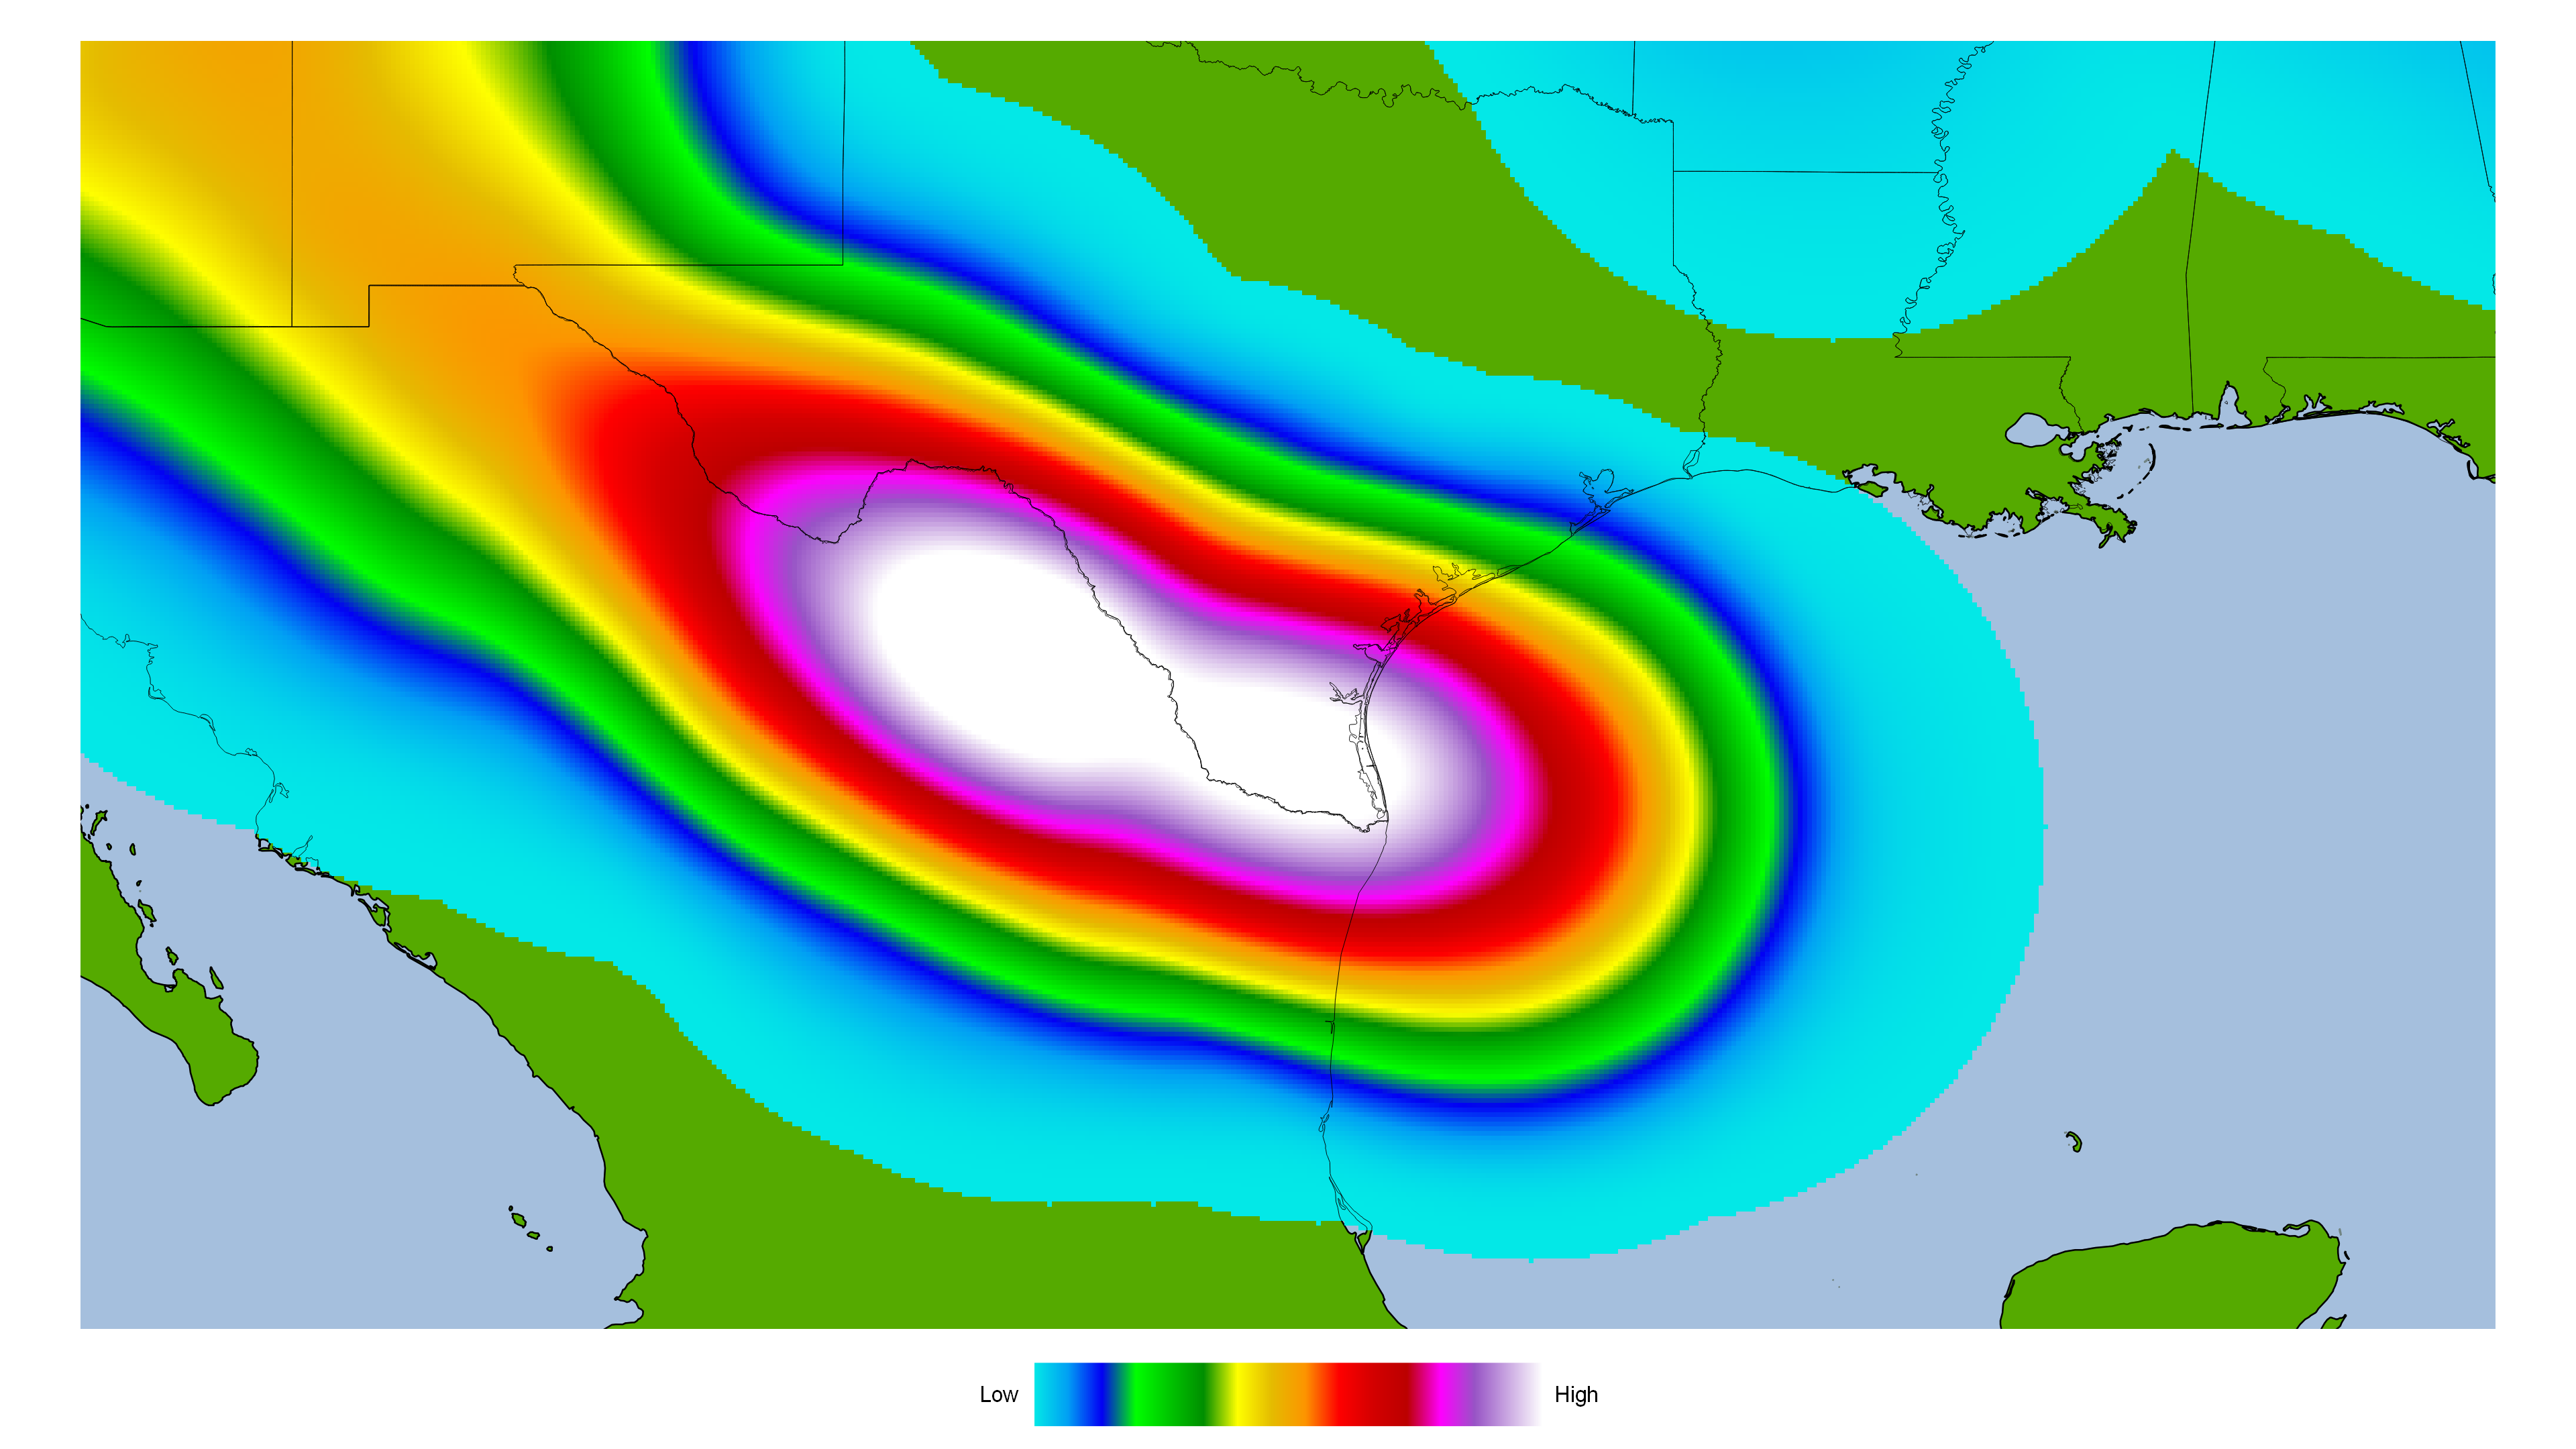
Here is the most recent forecast model for where Harold will go. The forecast model is from National Center for Atmospheric Research (NCAR). It is a heat map generated by QGIS. The heat map use points within 300 mile/480 kilometers radius. I used the latest forecast, which is at 0000Z.
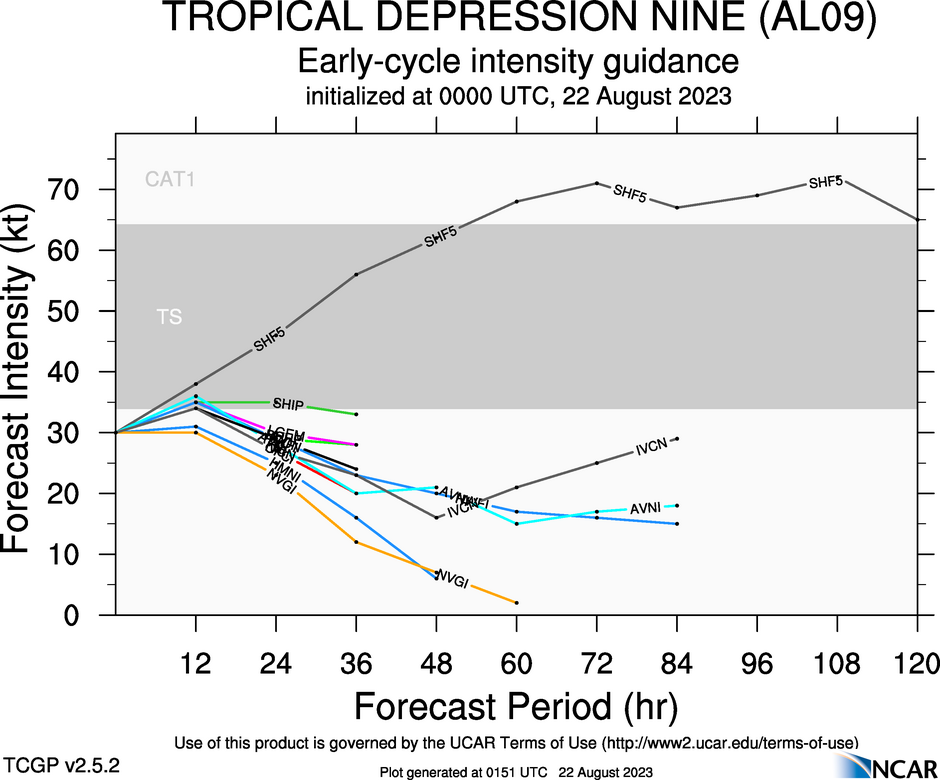
Most of the forecast models have Tropical Depression 9 heading towards South Texas. Some go far south as the mouth of Rio Grande River to far north as Corpus Christi. Most models have it going towards South Texas. There is a remote chance it could go towards Southeast Texas, but that is unlikely at this time. It currently remains a tropical depression. Here is the intensity forecast model from NCAR.
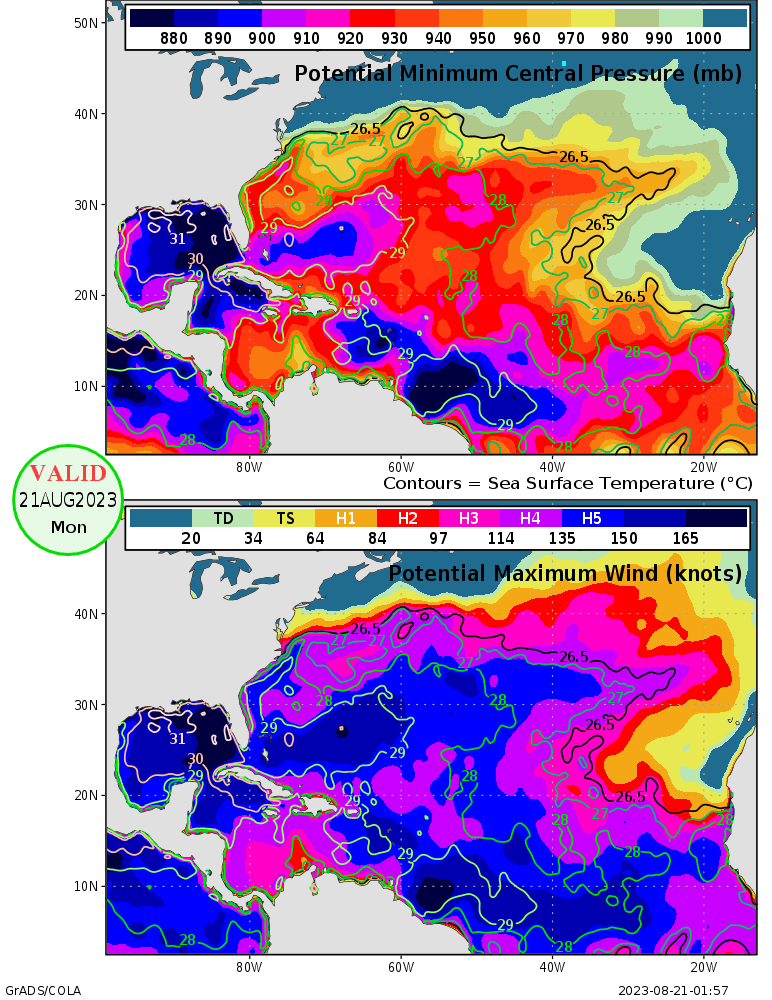
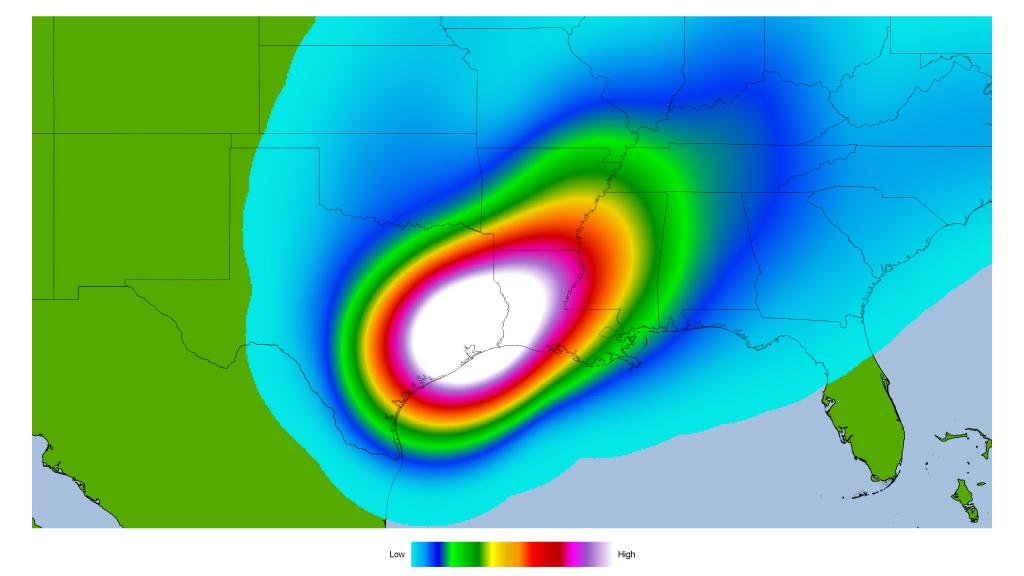
Most forecast models keep it as a tropical storm for a short time. One has it as a Category 1 hurricane, which keeps at as one far inland. The Gulf of Mexico is warm and can support Category 5 hurricane if conditions are right. Here is a Maximum Potential Hurricane Intensity for the Gulf of Mexico. It is courtesy of Center for Ocean-Land-Atmosphere (COLA).
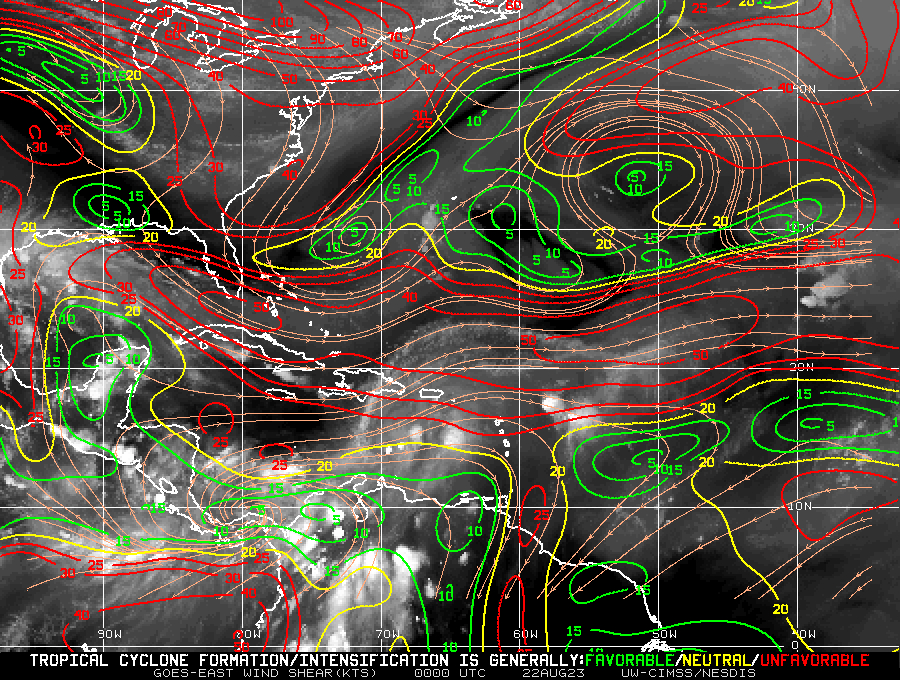
I would not be surprised if Harold becomes a strong tropical storm or even a Category 1 hurricane before landfall. A major hurricane is unlikely as it is moving rather quickly. That would keep a lid on any further intensification. Tropical Depression 9 also has to deal with strong wind shear. Here is a wind shear map from CIMSS.
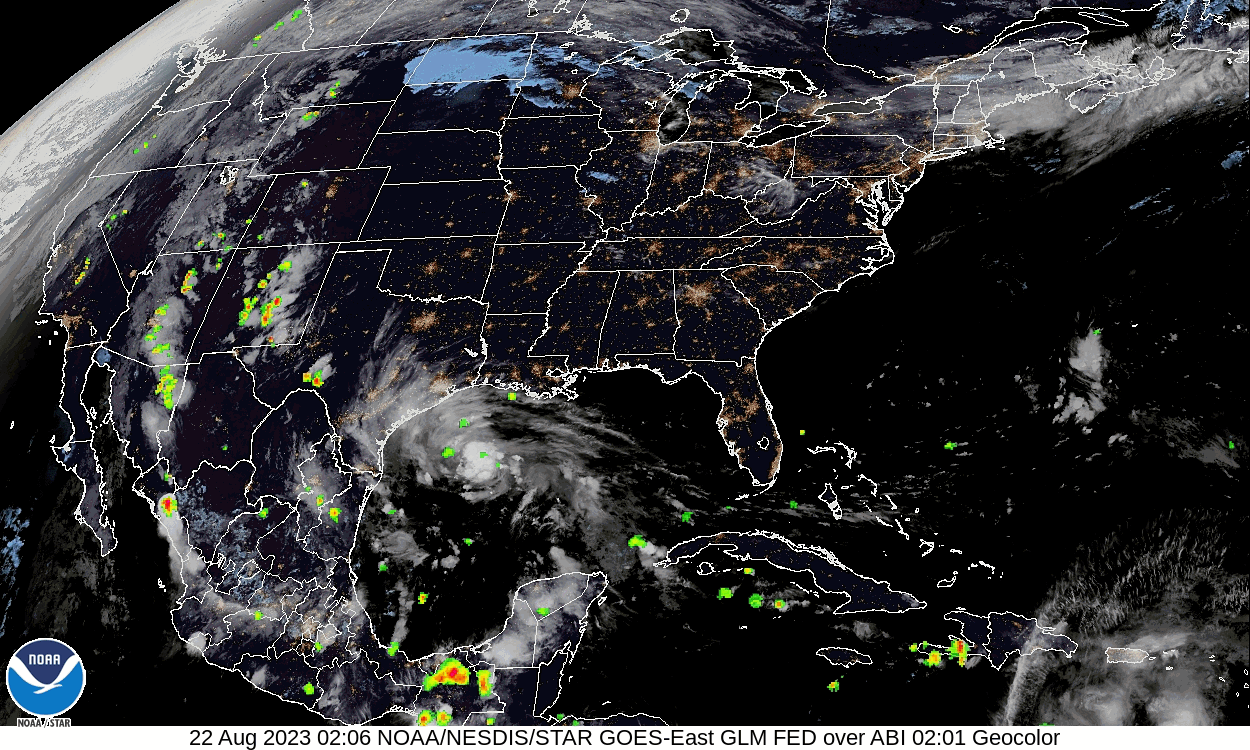
Wind shear and fast motion speed are likely to keep Harold as a tropical storm to Category 1 hurricane before landfall. Tropical cyclones have rapidly intensified right before making landfall on Texas. Something to not rule out with Harold. The satellite image of Tropical Depression 9 suggests it could be intensifying. There is also lightning near the center of future Harold. Here is a lightning flash map from GOES-East CONUS – Geostationary Lightning Mapper.
There was plenty of lightning near the center. It appears to have tapered off in terms of lighting. The circular shape also suggests it could be a tropical storm later tonight. The bandings around the tropical depression is also a sign Harold is about to form soon.
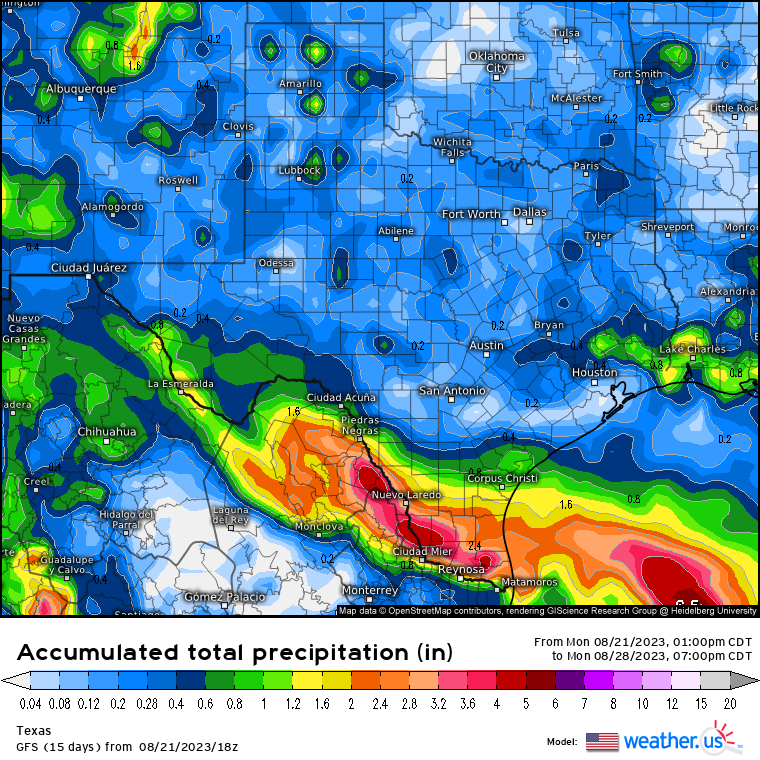
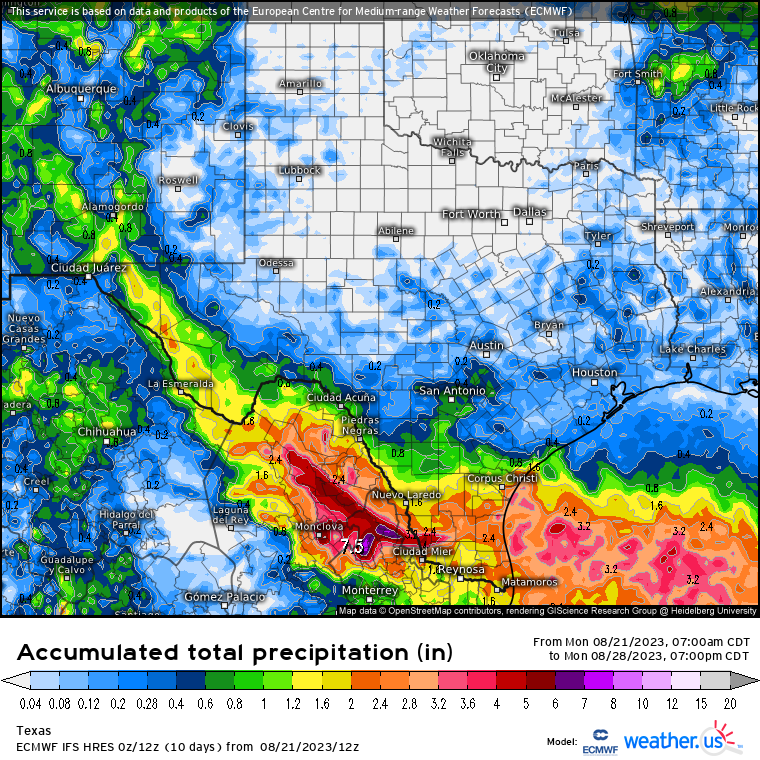
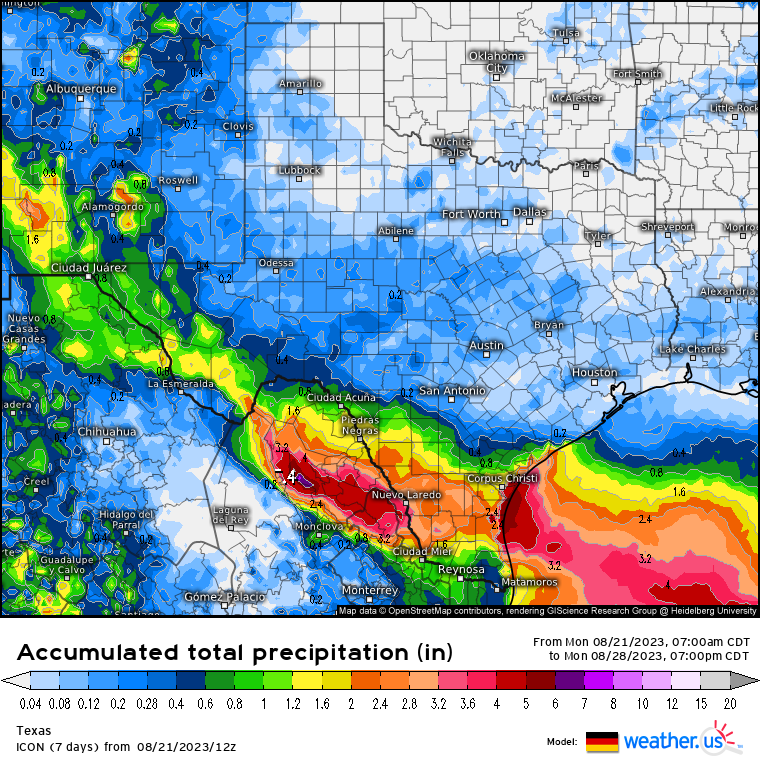
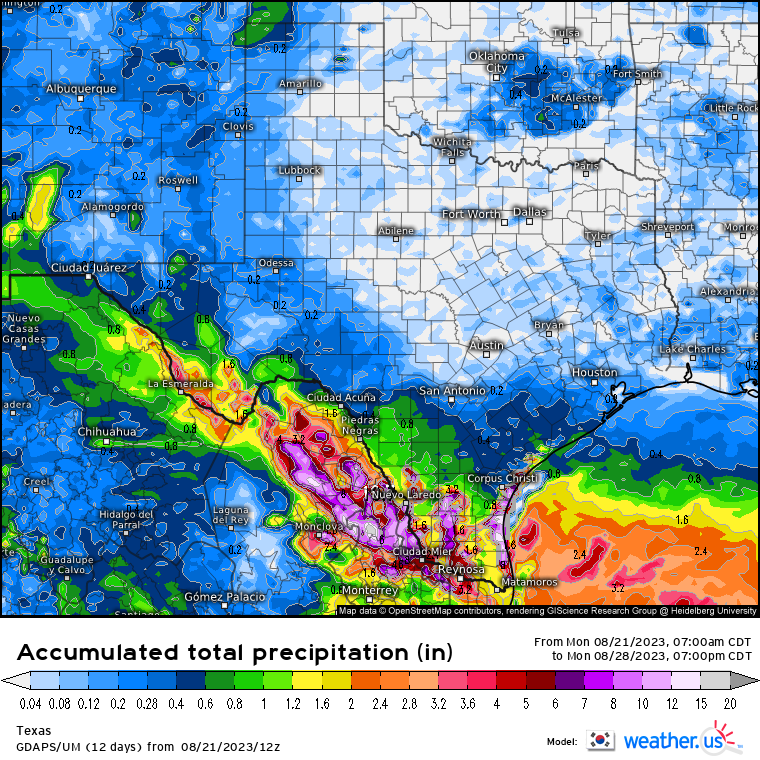
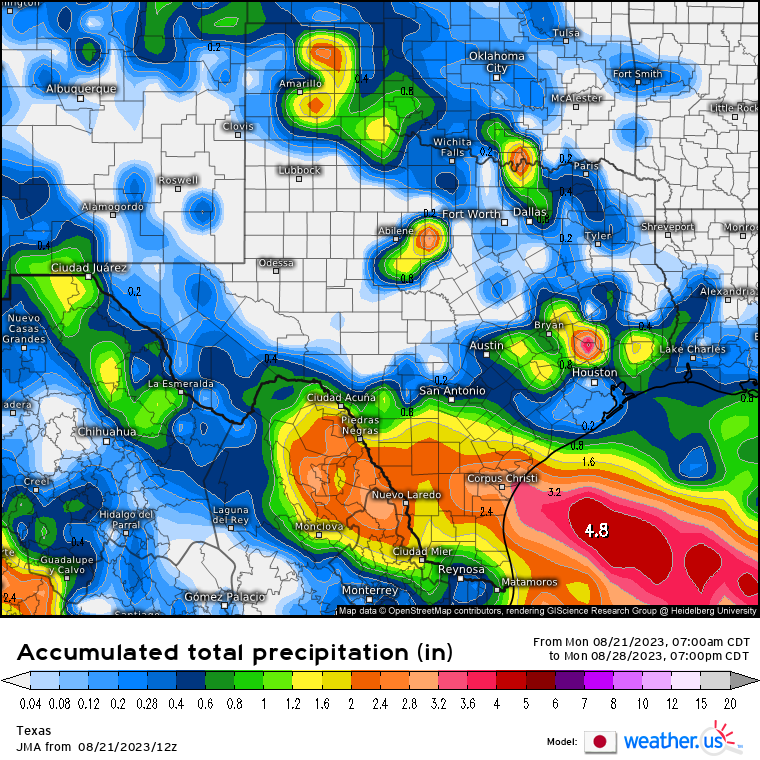
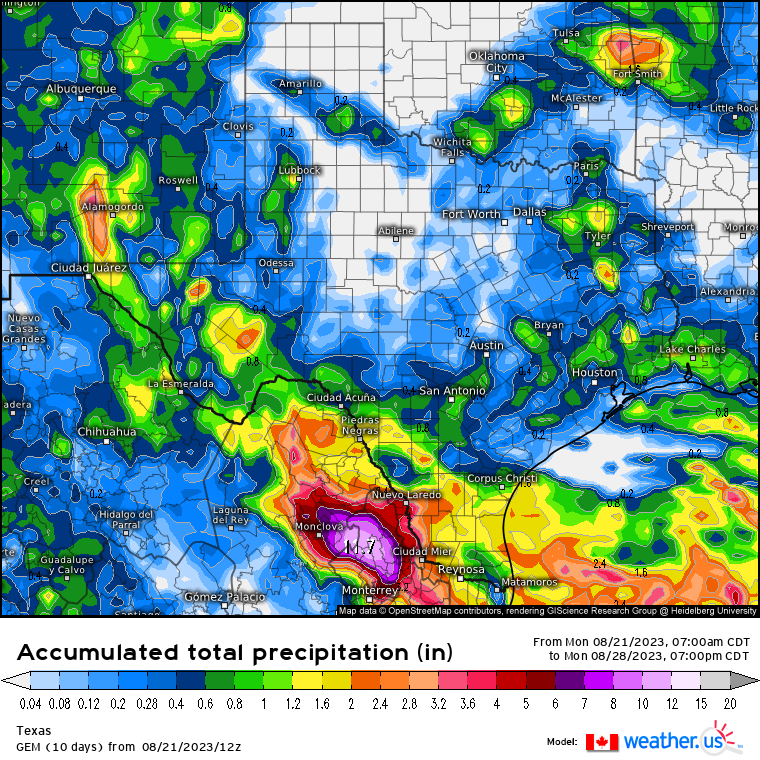
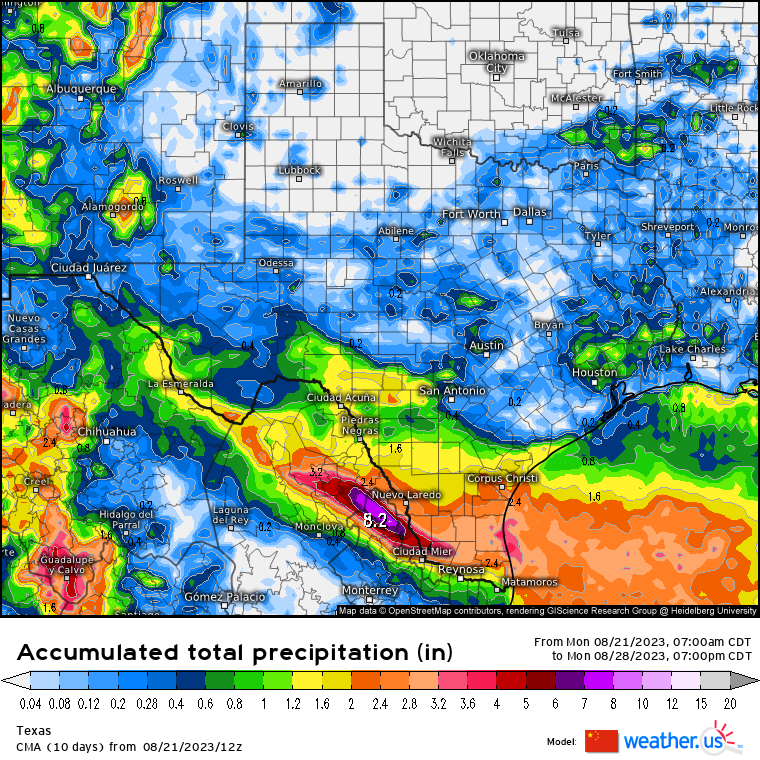
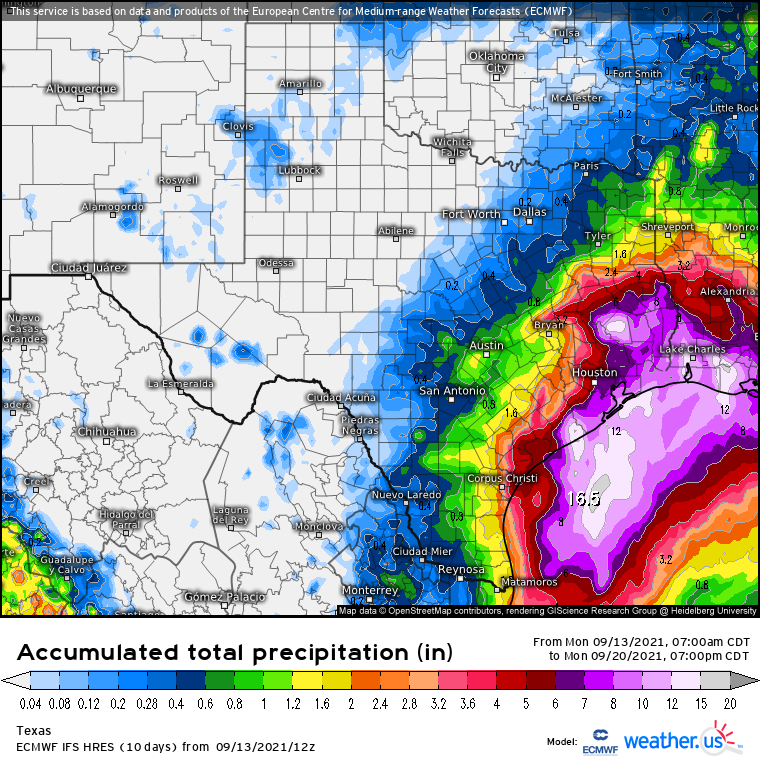
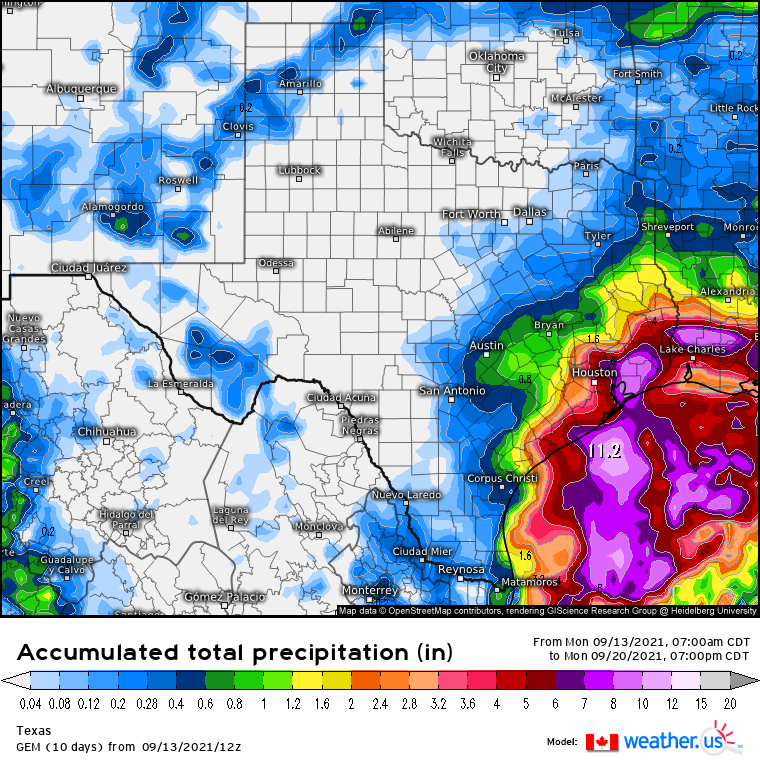
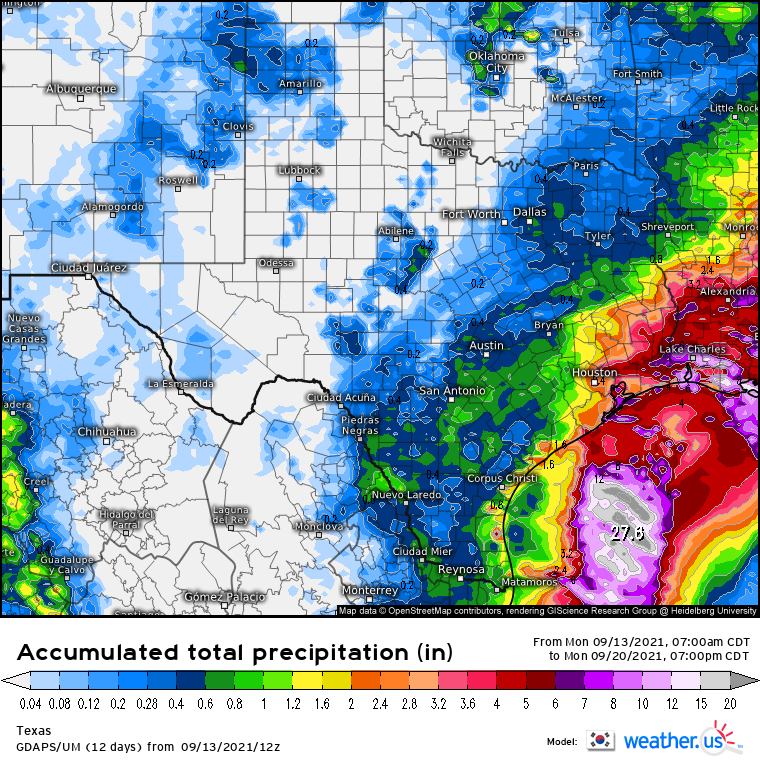
As with tropical systems, they often bring rain. How much rain will fall from future Harold? Here are rainfall forecast totals between August 21, 2023 to August 28, 2023. They are from Weather.US. The forecast models are: GFS (American) EURO (European) ICON (Germany) GDAPS/UM (South Korea) JMA (Japanese) GEM (Canadian) CMA (China)
The Korean has the highest amount of 19.70 inches of rain. The Japanese has the lowest amount of 4.80 inches. Quite a wide range forecast in terms of rainfall. I ran a statistical analysis using PSPP. I look at rainfall total forecast.
Mean
9.40
Median
7.50
Standard Deviation
5.00
95% Confidence Interval Lower Bound
4.78
95% Confidence Interval Upper Bound
14.02
The mean rainfall total is 9.40 inches with median of 7.50 inches. The 95% Confidence Interval range are from 4.78 inches to 14.02 inches. It is probable the rainfall total will be somewhere between 4 to 14 inches of rain. There is a five percent chance that it is not in the true mean. It means it could be below 4 inches or over 14 inches. I can say with 95% confidence that the rainfall total is probably going to be somewhere between 4 to 14 inches of rain. More than likely, it is over 4 inches of rain.
I suspect most areas will see between 1 to 3 inches of rain. Some areas could get over 6 inches. I would not rule out 12 inches or higher once it is all over. All the forecast models do have rain over Southeast Texas. The Japanese has the highest with 4 inches of rain in the next 7 days.
Here is what I think will happen. -Tropical Depression 9 will be Harold by morning. -Tropical Depression 9/Harold is likely to make landfall on South Texas. -Most areas in Texas will see rain.
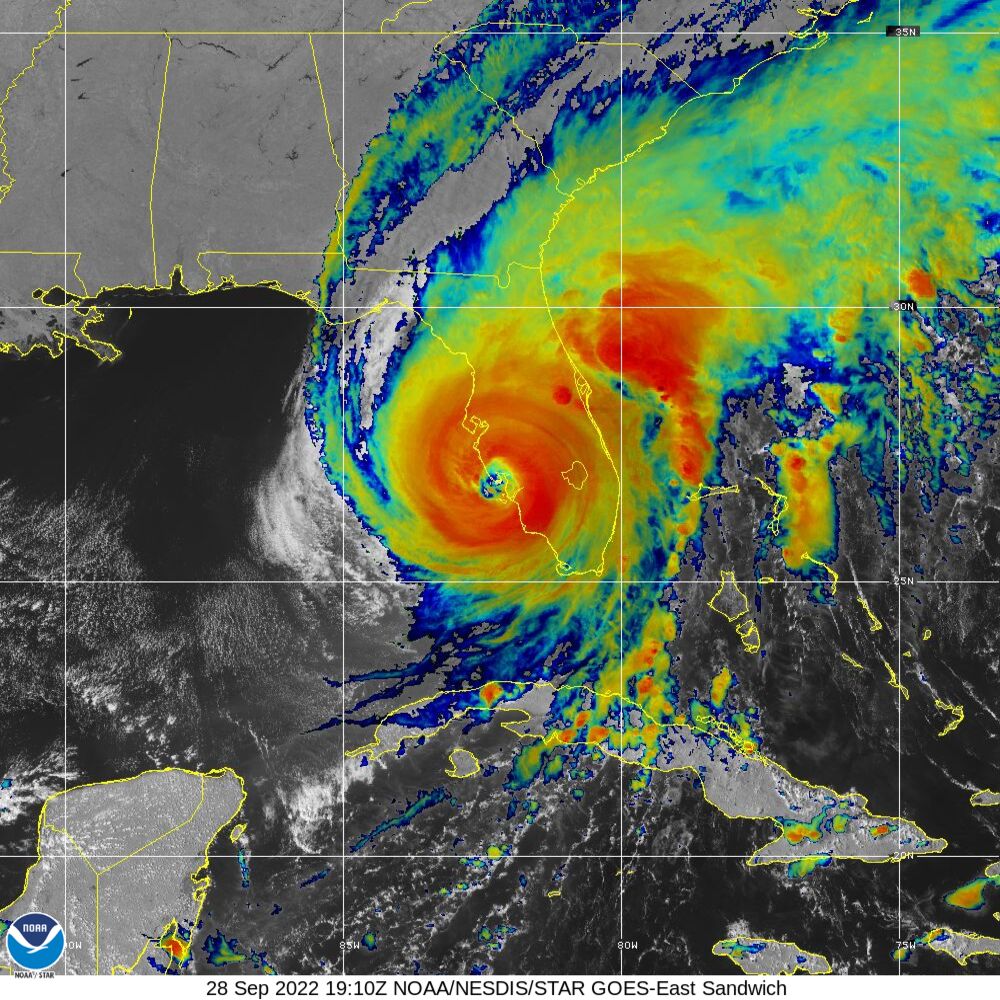
Hurricane Ian made landfall at 3:05 PM EDT on Cayo Costa and near Pirate Harbor at around at 4:35 PM EDT. Hurricane Ian made landfall as a Category 4 hurricane with 150 mph winds at Cayo Costa. Ian peaked at 155 mph winds and central pressure of 936 millibars. I would not be surprised if Ian gets upgraded to Category 5. Hurricane Ian gives a sense of deja vu with Hurricane Charley. Hurricane Charley made landfall on August 13, 2004.
Hurricane Charley made landfall at the almost same location where Hurricane Ian did. Even the landfall times are almost the same at 3:45 PM and 4:45 PM. Both had frontal boundary that impacted steering motion for them. Talk about eerily similar. However, there are differences between Charley and Ian.
Hurricane Ian is stronger with 155 mph winds and central pressure of 936 millibars at peak. Hurricane Charley peaked at 150 mph and 941 millibars. Charley is much smaller with hurricane force winds extending up to 25 miles from the eye. Tropical storm force winds extend up to 85 miles for Charley. Ian has hurricane force winds extending up to 45 miles from the eye. Ian has large tropical storm force winds extending up to 175 miles. Charley moved faster compared to Ian. The storm surge is much higher in Ian than in Charley. In terms of rain amount, Charley dumped 4 to 8 inches of rain. Ian has dumped over 12 inches of rain and still falling as of tonight (September 28, 2022). Charley is not a flood event, while Ian is looking to be a flood event.
Here are rainfall forecast totals between September 28, 2022 to October 6, 2022. They are from Weather.US. The forecast models are: GFS (American) EURO (European) GDAPS/UM (South Korea) GEM (Canadian) CMA (China)
GFS (American)EURO (European)GDAPS/UM (South Korean)GEM (Canadian)CMA (Chinese)
The Canadian has the lowest amount of 16.80 inches of rain. The Korean has the highest at 42.20 inches of rain. I ran a statistical analysis using PSPP. I look at rainfall total forecast.
Mean
24.92
Median
20.4
Standard Deviation
10.51
95% Confidence Interval Lower Bound
11.87
95% Confidence Interval Upper Bound
37.97
The mean rainfall total is 24.92 inches with median of 20.40 inches. The 95% Confidence Interval range are from 11.87 inches to 37.97 inches. It is probable the rainfall total will be somewhere between 12 to 38 inches of rain. There is a five percent chance that it is not in the true mean. It means it could be below 12 inches or over 50 inches. I can say with 95% confidence that the rainfall total is probably going to be somewhere between 12 to 38 inches of rain. More than likely, it is now over 12 inches of rain.
I would not be surprised if some areas in Florida see over 40 inches of rain from Hurricane Ian. If Hurricane Ian was to dump 40 inches or greater, that would be a record for Florida. The highest known 24 hour rainfall total for Florida is 38.70 inches in Yankeetown! The total rainfall from Easy is 45.20 inches, making it Florida’s wettest tropical system. It is probable some areas could of had higher rainfall totals from Easy. Ian could challenge Easy in terms of rainfall.
Here is what I think will happen. -Ian is likely to weaken overnight. -Ian is likely to be more of a heavy rain even for inland and East Coast of Florda. -Storm surge will remain a problem for Florida.
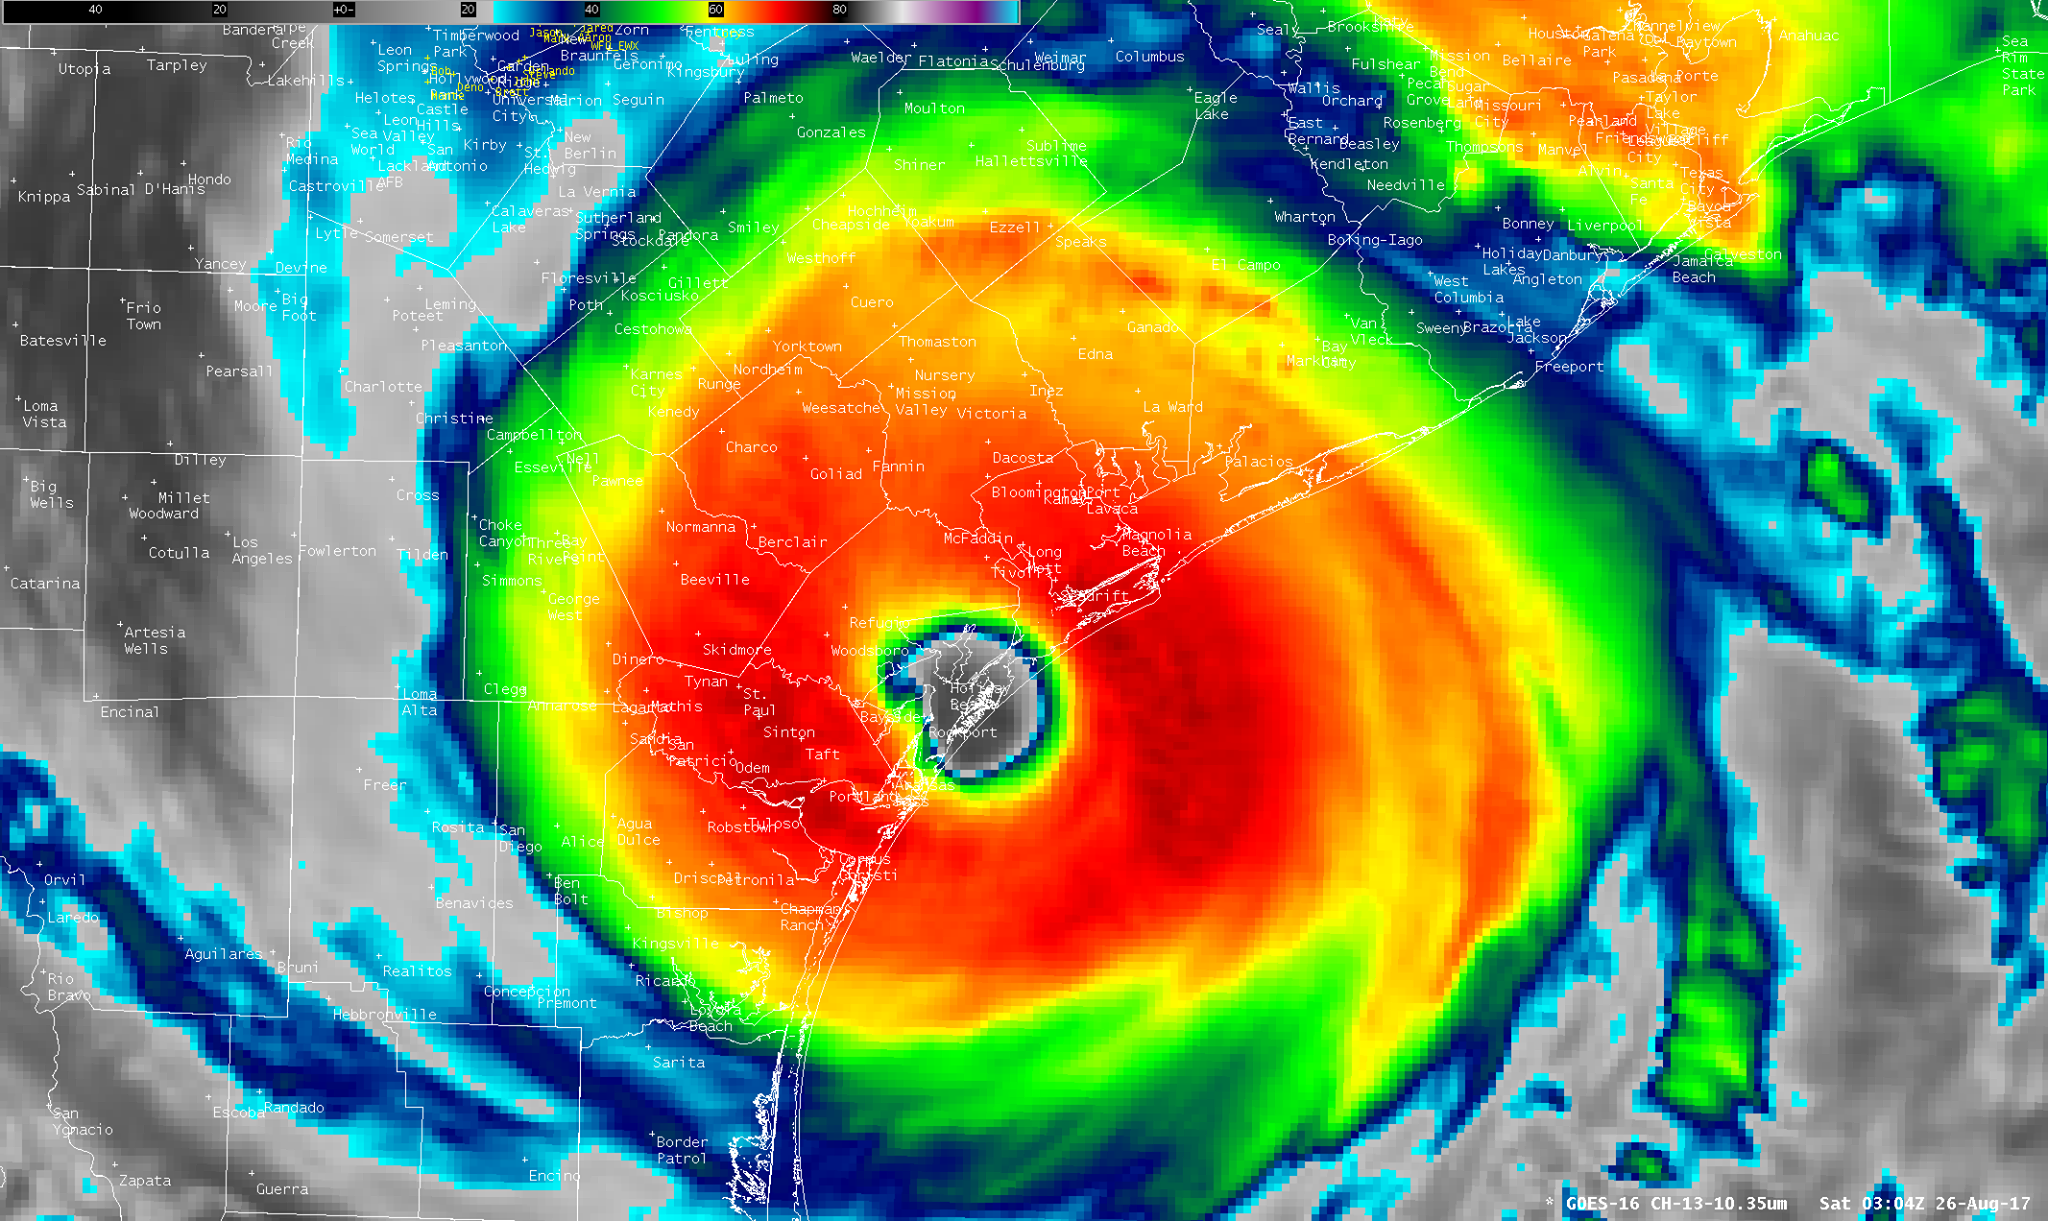
It is hard to believe, it has been five years since Hurricane Harvey made landfall near Port Aransas as a Category 4 hurricane with 130 mph winds. So much has happened since Harvey from COVID-19 Pandemic to Ukraine War. Harvey is the first major hurricane to make landfall on America since Wilma on October 24, 2005. Harvey made landfall on August 25, 2017. That is 43,23 days apart or 11 years, 10 months, 1 day or 142 months apart!
South Texas is hammered by strong wind, storm surge, and heavy rain. It packs a devastating punch. It is mainly along the coast in the Port Aransas area.
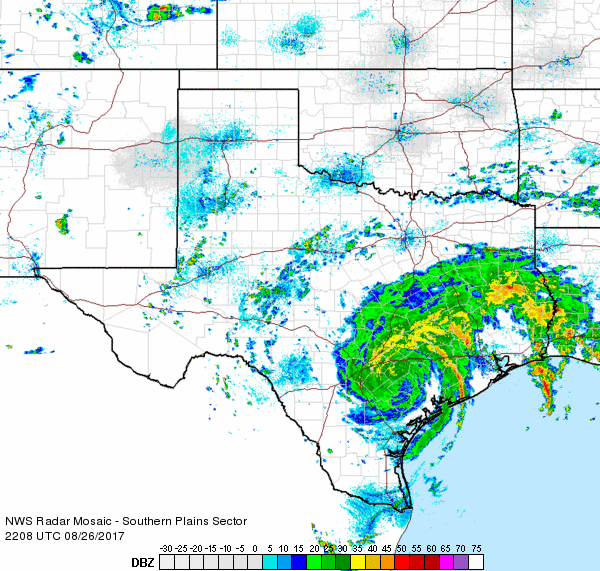
Once Harvey made landfall, it starts to weaken. Harvey is lingering over Texas. Large thunderstorms form near the center on the afternoon and evening of August 26, 2022. The large area of thunderstorms move toward Houston.
Doppler radar of Hurricane Harvey from National Weather Service.
The thunderstorms go over Houston area dumping heavy rain on the night of August 26, 2017 to the small hours of August 27, 2017. Heavy rain falls over and over on the Houston area.
Houston area is flooded. Large areas receive 15 to 35 inches of rain from Harvey! Many houses and buildings are flooded as bayous and rivers are overflowing from heavy rain. Streets and freeways are flooded.
Heavy rain continues to ravage Southeast Texas as Harvey lingers over Texas. Then Harvey exits Texas and goes over the Gulf of Mexico. Heavy rain falls over East Texas. Beaumont gets over 31 inches of rain including over 26 inches in a single calendar day on August 29, 2017!
Many areas saw over 30 inches of rain from Harvey. The highest recorded is 60.58 inches of rain in Nederland. Some areas likely got over 60 inches of rain. A Personal Weather Station (PWS) in Baytown recorded over 66 inches of rain during Harvey from August 25-31, 2017. The August 2017 total for that station is over 74 inches! I would not be surprised if some areas got up to 80 inches of rain from Harvey.
Once Harvey passed, it did $125 billion in damage, which is comparable to Hurricane Katrina in 2005. 103 people lost their life from Harvey in Texas. It is the deadliest Texas hurricane since 1919. The 1919 Florida Keys hurricane claimed at least 284 lives in Texas. It is likely up to 1,000 people died. It is probable more people died during Harvey, but were not counted.
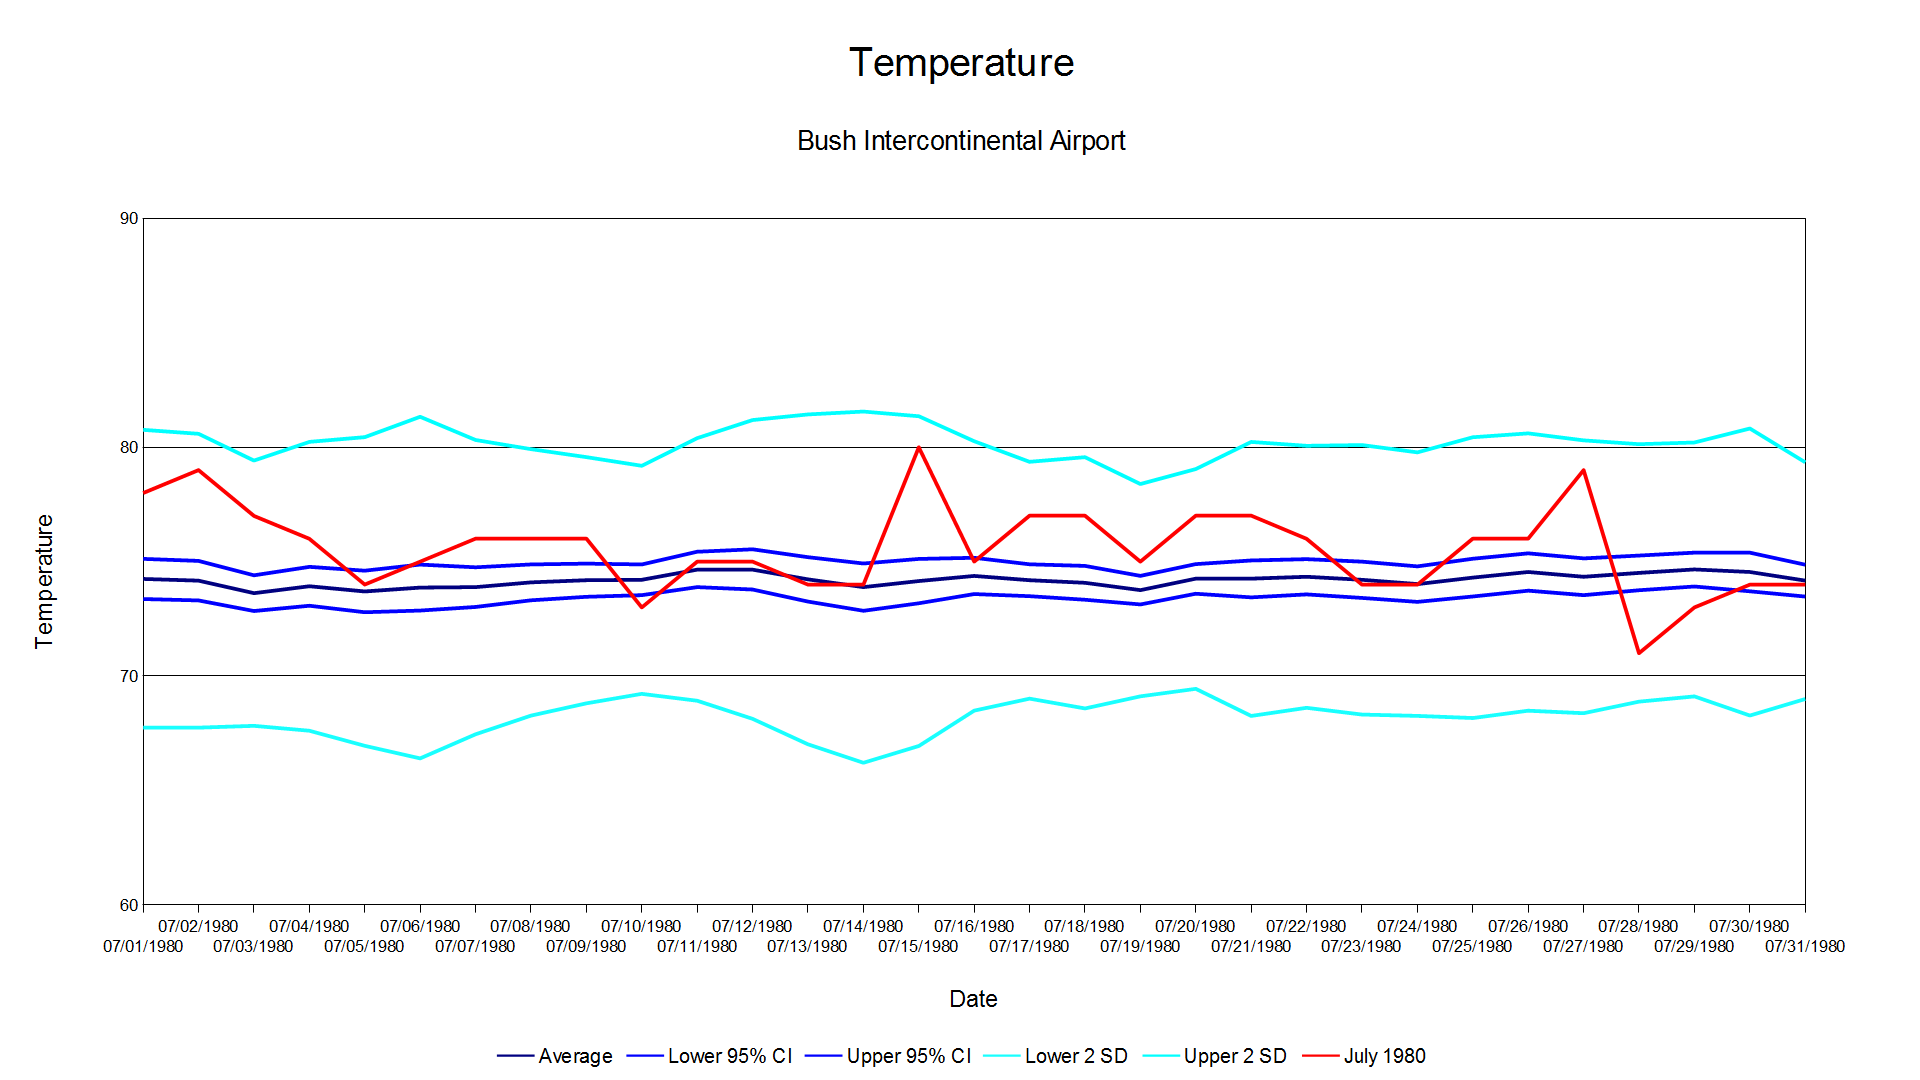
The headlines have been dominated by heat waves, wildfires, and floods. America is engulfed in a heat wave regardless of region. The heavy rain and floods claimed at least 37 lives in Eastern Kentucky. Eastern Kentucky has a heat wave on top of it. Northern California has been ravaged by wildfires. July 2022 has been the hottest on record for Houston. It eclipses July 1980, in which America was in midst of a heat wave. How does July 2022 compare for Houston and America? Let’s start with Houston.
Here are charts of high, low, and average temperature for Houston, which is at Bush Intercontinental Airport. The data is from Global Historical Climatology Network – Daily (GHCN-Daily), Version 3. I calculated using JASP and generated graphs with Apache OpenOffice. The average and standard deviation are from 1969 to 2021. The charts have 95% Confidence Interval (CI), 2 Standard Deviations (2 SD) below and above, and actual temperature. Anything that is above or below 2 SD is considered unusual as it is 95% or greater to exceed the average or mean. Here is the high temperature for July 2022.
The hottest day was 105°F on July 10, 2022. It is the hottest July 10th recorded in Houston. It ties as the hottest July day on record in Houston with July 26, 1954. Houston recorded its hottest July 11th and 13th on record. There are days where July 2022 highs exceeded 2 SD. For the most part, the highs were within 2 SD. Certainly hot, but not extremely hot. Here is the low temperature for July 2022.
The low temperatures in July 2022 were likely to exceed 2 SD compared to high temperatures. There were often above average. There are no days where low temperature is below average. There are multiples days where lows exceeded 2 SD. The highest low temperatures recorded in Houston were on July 10-12 and July 18-20. They broke records for warmest low temperature recorded. The warm low temperatures contributed to July 2022 being warmest on record in Houston. Here is the average temperature for July 2022.
The average temperature exceeded 2 SD due to warm nights and days on July 10-12 and July 18-20. Let’s look at July 1980, the previous hottest July on record in Houston. Here is the high temperature for July 1980.
July 1980 highs were more likely to exceed 2 SD compared to July 2022. Many record July highs in Houston were set in July 1980. Texas and America were engulfed in a heat wave. The 1980 heat wave claimed at least 10,000 lives. The 1980 heat wave claimed more lives than 9/11, Hurricane Katrina or Hurricane Maria. July 1980 had more 100°F days than July 2022. July 1980 had 18 100°F days, while July 2022 had 13 100°F days. July 1980 is certainly hotter than July 2022 on that ground. Here is the low temperature for July 1980.
The low temperatures of July 1980 were within 2 SD. They were more likely to be within the average than July 2022. There were no record warm low temperatures set in July 1980, unlike in July 2022. There are some days in July 1980 that are below average. The low temperature is the reason why July 2022 is the warmest on record. If July 1980 had warm low temperatures of July 2022, it would easily exceed July 2022 as the warmest on record. Here is the average temperature for July 1980.
The average temperature exceeded 2 SD in July 1980. However, they are not on the level of July 2022 in terms of average temperature. July 1980 had normal low temperatures, while July 2022 had warm low temperatures, which kept things warm. Here is a 2 meter temperature anomaly of the Northern Hemisphere for July 2022. It includes America. It is from Daily Mean Composites.
It was certainly hot in America. It was also hot in Europe and East Asia. The cold weather are mostly in Russian Far East, Siberia, Central Asia, Alaska, and Northwest Canada. It was certainly hot in July 2022. Now, if you think July 2022 was really hot, try July 1936. Here is a 2 meter temperature anomaly of the Northern Hemisphere for July 1936. It is from 20th Century Reanalysis Daily Composites.
July 1936 was very hot in America. It was in midst of the Dust Bowl as there was the Great Depression. The Dust Bowl likely exacerbated the Great Depression as farmers suffered greatly. Many records were set in July 1936 and August 1936. The Summer of 1936 is the hottest on record for America. They are yet to be broken to this very day.
Texas’s hottest recorded day occurred on August 12, 1936 in Seymour. Seymour reached a high of 120°F. It also reached 120°F in Monahans on June 28, 1994. They are Texas’s highest recorded temperature and yet to be broken to this very day. Oklahoma’s hottest days (not a mistype as it happened more than once) recorded occurred four times in 1936 in Alva (July 18, 1936), Altus (July 19, 1936 and August 12, 1936), and Poteau (August 10, 1936) as they reached 120°F. They are yet to be broken in Oklahoma to this very day. North Dakota’s hottest recorded day occurred on July 6, 1936 in Steele with a high of 121°F. It is North Dakota’s hottest day recorded. It is yet to be broken to this very day for North Dakota. New York City’s hottest recorded day occurred on July 9, 1936 with a high of 106°F. It remains the hottest day recorded in New York City to this very day. The 1936 Annual Heat Wave Index in America is the highest. It easily exceeds 2022.
The death toll from the July 1936 heat wave is at least 5,000 people. There was a jump in mortality in 1936 compared to 1935. It suggests the heat wave claimed more than 5,000 lives directly and indirectly. America had over 128 million people in 1936. If the July 1936 heat wave happened today with the current population, the death toll would exceed at least 12,000 lives and likely higher.
July 2022 was certainly hot, but it does not come nowhere to July 1936. It was really hot back in 1936. People managed to survive as people did not have air conditioning. Few people had air conditioning in their homes. Some people slept outside at night as it was cooler outside than inside. I would not be surprised if there were heat waves comparable to and exceeding 1936 that occurred in the past.
It is hard to believe it has been thirteen years since Hurricane Ike made landfall on this day in Southeast Texas. It has been nearly a year since Tropical Storm Beta made landfall. Now, we have Tropical Storm Nicholas. The National Hurricane Center has Nicholas a near hurricane with 70 mph/110 km/h winds as of 7:00 PM CDT. Where does Nicholas go and will it stall over Texas? Here is the forecast model from National Center for Atmospheric Research (NCAR). It is a heat map generated by QGIS. The heat map use points within 300 mile/480 kilometers radius. I used the latest forecast, which is 1800Z.
The heat map is not as circular, as it is more oval. A more circular heat would suggest that Nicholas could linger over Texas. However, it looks more likely Nicholas will exit Texas. Nicholas is not going to be another Harvey at this time. That is a good thing as Harvey dumped heavy rain over Southeast Texas for nearly a week. The next question is how strong will Nicholas be before landfall.
Most intensity forecast models keep Nicholas as a tropical storm. One has it near hurricane. Intensity forecast models are not reliable. I think Nicholas could further intensify into a hurricane before landfall. I would not be surprised if Nicholas makes landfall with 75 to 80 mph (120 to 128 km/h) winds. The most concerning aspect is the rainfall from Nicholas. Southeast Texas had string of floods from Memorial Day 2015, Tax Day 2016, Memorial Day 2016, Harvey, and Imelda. Here are forecast models of rainfall totals. The forecast models are from Weather.US. They are all seven day rainfall total forecast.
The forecast modes are: EURO (European) ICON (German) GFS (American) GEM (Canadian) CMA (China) UM (South Korea)
EUROICONGFSGEMCMAUM
The Korean forecast model has the highest rainfall total of over 27 inches of rain. The EURO has over 16 inches of rain. Most forecast models have between 10 to 11 inches of rain. The forecast models are all over the place where the heaviest rain will fall. Some have it off shore, while some have it over land. I ran a statistical analysis using PSPP. The forecast are from highest rainfall totals in the forecast models.
The mean is 14.85 inches and median is 11.55 inches. The 95% Confidence Interval range are from 7.92 to 21.78 inches. It is probable the highest amount is somewhere between 8 to 21 inches of rain. There is a five percent chance that it is not in the true mean. It means it could be less than 8 inches or over 21 inches. I can say with 95% confidence that the the highest rainfall total will probably be somewhere between 8 to 22 inches with the mean of 15 inches. I would not be surprised if some areas have nearly 25 inches of rain before it is all over.
Here is what I think will happen. -Nicholas could further intensify into a Category 1 hurricane before landfall. -Rainfall amounts could range from 10 to 15 inches/25.4 to 38.1 centimeters of rain with isolated totals approaching 25 inches/63.5 centimeters. -Some areas could see flooding.
Monster Hurricane Eta is off the coast of Honduras and Nicaragua. It is a monster Category 4 hurricane with 150 mph winds. Here is the most recent advisory from the National Hurricane Center (NHC).
000
WTNT34 KNHC 030251
TCPAT4

BULLETIN
Hurricane Eta Advisory Number  10
NWS National Hurricane Center Miami FL       AL292020
1000 PM EST Mon Nov 02 2020

...AIR FORCE RESERVE HURRICANE HUNTERS FIND THAT ETA HAS CONTINUED
TO RAPIDLY STRENGTHEN AS IT APPROACHES NORTHEASTERN NICARAGUA...
...LIFE-THREATENING STORM SURGE, CATASTROPHIC WINDS, FLASH FLOODING,
AND LANDSLIDES EXPECTED ACROSS PORTIONS OF CENTRAL AMERICA...


SUMMARY OF 1000 PM EST...0300 UTC...INFORMATION
-----------------------------------------------
LOCATION...14.1N 82.7W
ABOUT 70 MI...115 KM SSE OF CABO GRACIAS A DIOS ON NIC/HON BORDER
ABOUT 45 MI...75 KM E OF PUERTO CABEZAS NICARAGUA
MAXIMUM SUSTAINED WINDS...150 MPH...240 KM/H
PRESENT MOVEMENT...WSW OR 245 DEGREES AT 7 MPH...11 KM/H
MINIMUM CENTRAL PRESSURE...927 MB...27.38 INCHES


WATCHES AND WARNINGS
--------------------
CHANGES WITH THIS ADVISORY:

None.

SUMMARY OF WATCHES AND WARNINGS IN EFFECT:

A Hurricane Warning is in effect for...
* The coast of Nicaragua from the Honduras/Nicaragua border to
Sandy Bay Sirpi

A Tropical Storm Warning is in effect for...
* The northeastern coast of Honduras from Punta Patuca to the
Honduras/Nicaragua border

A Hurricane Watch is in effect for...
* The northeastern coast of Honduras from Punta Patuca to the
Honduras/Nicaragua border

A Tropical Storm Watch is in effect for...
* The northern coast of Honduras from west of Punta Patuca westward
to Punta Castilla

A Hurricane Warning means that hurricane conditions are expected
somewhere within the warning area, in this case within the next 12
hours or so.  Preparations to protect life and property should be
completed.

A Tropical Storm Warning means that tropical storm conditions are
expected somewhere within the warning area within 36 hours.

A Hurricane Watch means that hurricane conditions are possible
within the watch area.  A watch is typically issued 48 hours
before the anticipated first occurrence of tropical-storm-force
winds, conditions that make outside preparations difficult or
dangerous.

A Tropical Storm Watch means that tropical storm conditions are
possible within the watch area, generally within 48 hours.

Interests elsewhere in Nicaragua and Honduras should monitor the
progress of this system.

For storm information specific to your area, please monitor
products issued by your national meteorological service.


DISCUSSION AND OUTLOOK
----------------------
At 1000 PM EST (0300 UTC), the center of of the eye of dangerous
Hurricane Eta was located by reconnaissance aircraft and radar from
San Andreas near latitude 14.1 North, longitude 82.7 West. Eta is
moving toward the west-southwest near 7 mph (11 km/h), and this
general motion is expected to continue through early Tuesday.  A
slower westward or west-northwestward motion is forecast to begin by
Tuesday afternoon and continue through Thursday.  On the forecast
track, the center of Eta is expected to make landfall along the
coast of Nicaragua within the Hurricane Warning area early Tuesday.
The center of Eta is forecast to move farther inland over northern
Nicaragua through Wednesday night, and then move across central
portions of Honduras on Thursday.

Reports from the Hurricane Hunter aircraft indicate that maximum
sustained winds are near 150 mph (240 km/h) with higher gusts.  Eta
is a category 4 hurricane on the Saffir-Simpson Hurricane Wind
Scale.  Some strengthening is forecast during the next 12 hours, and
Eta could become a category 5 hurricane before it makes landfall.
Weakening will begin after the cyclone moves inland. An Air Force
Reserve hurricane hunter aircraft is currently investigating Eta
and will provide more data tonight.

Hurricane-force winds extend outward up to 25 miles (35 km) from the
center and tropical-storm-force winds extend outward up to 125 miles
(205 km).

The minimum central pressure based on data from the aircraft is
estimated to be 927 mb (27.38 inches).


HAZARDS AFFECTING LAND
----------------------
Key messages for Eta can be found in the Tropical Cyclone Discussion
under AWIPS header MIATCDAT4 and WMO header WTNT44 KNHC.

WIND:  Catastrophic wind damage is expected where Eta's eyewall
moves onshore within the Hurricane Warning area beginning tonight,
with tropical storm conditions beginning within the next few hours.
Tropical storm conditions are expected in the Tropical Storm Warning
area tonight, and hurricane conditions are possible in the Hurricane
Watch area by early Tuesday.  Tropical Storm conditions are possible
in the Tropical Storm Watch area by early Tuesday.

RAINFALL:  Eta is expected to produce the following rainfall amounts
through Friday evening:

Much of Nicaragua and Honduras: 15 to 25 inches (380 to 635 mm),
isolated amounts of 35 inches (890 mm).

Eastern Guatemala and Belize: 10 to 20 inches (255 to 510 mm),
isolated amounts of 25 inches (635 mm).

Portions of Panama and Costa Rica: 10 to 15 inches (255 to 380 mm),
isolated amounts of 25 inches (635 mm).

Jamaica and southeast Mexico: 5 to 10 inches (125 to 255 mm),
isolated amounts of 15 inches (380 mm) over southern areas.

El Salvador, Southern Haiti, and the Cayman Islands: 3 to 5 inches
(75 to 125 mm), isolated amounts of 10 inches (255 mm)

This rainfall would lead to catastrophic, life-threatening flash
flooding and river flooding, along with landslides in areas of
higher terrain of Central America.  Flash flooding and river
flooding would be possible across Jamaica, southeast Mexico, El
Salvador, southern Haiti, and the Cayman Islands.

STORM SURGE:  A dangerous storm surge will raise water levels by as
much as 14 to 21 feet above normal tide levels in areas of onshore
winds along the coast of Nicaragua within the hurricane warning
area, and 3 to 5 feet above normal tide levels along the coast of
Honduras within the tropical storm warning area.  Near the coast,
the surge will be accompanied by large and destructive waves.

SURF:  Swells generated by Eta are expected to affect portions of
the coast of Central America and the Yucatan Peninsula of Mexico
during the next few days.  These swells are likely to cause
life-threatening surf and rip current conditions.  Please consult
products from your local weather office.


NEXT ADVISORY
-------------
Next intermediate advisory at 100 AM EST.
Next complete advisory at 400 AM EST.

$$
Forecaster Stewart
000
WTNT44 KNHC 030259
TCDAT4

Hurricane Eta Discussion Number  10
NWS National Hurricane Center Miami FL       AL292020
1000 PM EST Mon Nov 02 2020

An Air Force Reserve reconnaissance aircraft has found that Eta has
explosively deepened into a strong category 4 hurricane with maximum
sustained winds of 130 kt and a minimum central pressure of 927 mb.
Eta has maintained a small 10-nmi-wide eye that is evident in
satellite imagery and on the San Andreas, Colombia, weather radar.
The radar data also suggest that concentric eyewalls may be forming,
which would be an indication of the onset of an eyewall replacement
cycle (ERC) and a capping of Eta's intensity and also an end to the
rapid intensification cycle of the past 36 hours. The initial
intensity of 130 kt kt is based on 700-mb flight-level winds of 137
kt and SFMR surface winds of 130 kt. Some additional strengthening
is expected, and Eta could become a category 5 hurricane before
landfall occurs. After landfall, Eta should quickly weaken while it
moves over the mountainous terrain of Central America.

Eta has slowed and is now moving southwestward or 245/06 kt. There
is no significant change to previous track forecast reasoning. A
mid-level ridge over the south-central United States should steer
Eta west-southwestward toward the coast of Nicaragua with the
hurricane making landfall early Tuesday.  After landfall, Eta should
turn westward and then west-northwestward, and move across Central
America through Thursday. Eta's low-level circulation may not
survive its passage over the mountainous terrain of Central America,
but most of the global models continue to depict a cyclone or its
remnants moving over the northwestern Caribbean Sea by late-week and
into the weekend. Therefore, the new NHC track forecast continues to
show the system emerging over the northwestern Caribbean late in the
period, although this portion of the track forecast remains
uncertain.

Since Eta is likely to be a very slow-moving system after it makes
landfall in Central America, torrential rains and flooding will be
a major threat.

Key Messages:

1. Catastrophic wind damage is expected where Eta's eyewall moves
onshore along the northeastern coast of Nicaragua tonight or early
Tuesday.  Tropical storm force winds are beginning to reach the
coast within the Hurricane Warning area in Nicaragua, and residents
there should have completed their preparations.  A Tropical Storm
Warning is also in effect for the northeastern coast of Honduras.

2. A catastrophic and life-threatening storm surge, along with
destructive waves, are expected along portions of the northeastern
coast of Nicaragua near and to the north of where the center makes
landfall.  Water levels could reach as high as 14 to 21 feet above
normal tide levels in some parts of the hurricane warning area.
Preparations to protect life and property should now be complete.

3. Through Friday evening, heavy rainfall from Eta will likely
lead to catastrophic, life-threatening flash flooding and river
flooding across portions of Central America, along with landslides
in areas of higher terrain.  Flash and river flooding is also
possible across Jamaica, southeast Mexico, El Salvador, southern
Haiti, and the Cayman Islands.


FORECAST POSITIONS AND MAX WINDS

INIT  03/0300Z 14.1N  82.7W  130 KT 150 MPH
 12H  03/1200Z 13.9N  83.3W  140 KT 160 MPH
 24H  04/0000Z 13.9N  84.0W   90 KT 105 MPH...INLAND
 36H  04/1200Z 13.9N  85.0W   45 KT  50 MPH...INLAND
 48H  05/0000Z 14.3N  86.3W   30 KT  35 MPH...INLAND
 60H  05/1200Z 14.8N  87.8W   25 KT  30 MPH...POST-TROP/REMNT LOW
 72H  06/0000Z 15.4N  88.7W   30 KT  35 MPH...POST-TROP/REMNT LOW
 96H  07/0000Z 16.8N  87.9W   30 KT  35 MPH...POST-TROP/REMNT LOW
120H  08/0000Z 17.9N  85.3W   40 KT  45 MPH

$$
Forecaster Stewart
NHC forecasts a Category 5 hurricane. Looking at the satellite image, I think Eta is already a Category 5 hurricane. Here is a forecast model for Eta from National Center for Atmospheric Research (NCAR). All forecasts are from NCAR unless specified.
A couple of forecast models have Eta as a Category 5 hurricane, Most have it weakening. Intensity forecast models are unreliable. I think Eta will be a Category 5 hurricane. Here are my reasoning. I look at the water. Here is the Tropical Cyclone Heat Potential from Tropical Cyclone Heat Potential map of the Gulf of Mexico from NOAA.
The water off of Honduras and Nicaragua is warm, which is conducive for rapid intensification. The waters are quite warm as it goes deep. The deep warm water makes it favorable for intensification including rapid intensification. Here is a map of Maximum Potential Hurricane Intensity from The Center for Ocean-Land-Atmosphere Studies.
The Caribbean can support a powerful Category 5 hurricane with winds as high as 180 mph and central pressure of 880 millibars! Warm water is not the only factor to look at. I look at wind shear. Here is a wind shear map from CIMSS.
The wind shear level around Eta is low. That makes it favorable for further intensification into Category 5 hurricane. Low wind shear and warm water is favorable for intensification. Eta has both, which is going to be really problematic for Central America. Where does Eta go? Here is a heat map of forecast models. The heat map use points within 300 mile/480 kilometers radius. I used the latest forecast, which is 0000Z. The heat is generated by QGIS.
Most forecast models have Eta making landfall on either Nicaragua or Honduras. It looks to make landfall as a Category 4 or 5 hurricane. It is going to be really bad on top of the COVID-19 pandemic plaguing the world. Honduras has over 98,000 confirmed cases, while Nicaragua has over 5,500 confirmed cases per Worldometer. I suspect the cases numbers are much higher in Honduras and Nicaragua as COVID-19 has ravaged the Americas. Central America has had deadly history with hurricanes. Some of the deadliest Atlantic hurricanes have occurred in Central America. Hurricane Fifi and Mitch are some of the deadliest hurricanes known.
Hurricane Fifi went slowly across Central America in September 1974. The hurricane brought heavy rain over Honduras, which led to deadly flooding and mudslide. Fifi made landfall on Placencia, Belize as a Category 2 hurricane. The death toll from Fifi is up to 10,000 people killed. Most of the deaths occurred in Honduras.
An even deadlier hurricane occurred in late October 1998, Mitch. It is a powerful Category 5 monster that lingered over the Caribbean. It had 180 mph winds and central pressure of 905 millibars. Mitch is the strongest hurricane since Gilbert in 1988. It is also one of the most intense hurricanes on record for the Atlantic as of 2020. Mitch made landfall east of La Ceiba, Honduras as a Category 1 hurricane.
Mitch lingered over Central America dumping heavy rain over a large area. Many areas see rain amounts of over 60 inches with amounts as high as 100 inches or higher! The massive rainfall totals lead to deadly flooding and mudslide. The floods claim at least 19,000 lives, mainly in Honduras and Nicaragua. Mitch is the second deadliest Atlantic hurricane after the Great Hurricane of 1780.
Does this mean Eta will be another Fifi or Mitch? I am not in anyway suggesting Eta will be another Fifi or Mitch. Since Eta is forecasted to linger over Central America, that could be a severe problem. It depends on how long Eta lingers and size of the storm. Eta has tropical storm force winds extending up to 125 miles, while Mitch had tropical storm force winds extending up to 175 miles. Mitch was over Central America for 5 days, while Fifi stayed off the coast for 3 days before making landfall. It is no wonder that Fifi and Mitch were really devastating for Central America. Mitch is much worse as it lingered over land for 5 days and dumped extremely heavy rain over mountainous areas.
It is going to be a horrific disaster for Honduras and Nicaragua. Too much to bear in this horrible year of 2020. This could make COVID-19 worse for Honduras and Nicaragua. They really need to prepare for Eta.
NOAA/NESDIS/STAR GOES ABI BAND 07 OR_ABI-L1b-RadC-M6C07_G16_s20203020256160_e20203020258544_c20203020259015.nc
Talk about crazy all around in this year of uncertainty, 2020. There are winter storms in Texas and Oklahoma in October. It is not even winter yet.
To make matters worse, COVID-19 remains a huge problem worldwide. There are over 44 million confirmed COVID-19 cases worldwide.
Now, there is Tropical Storm Delta. It made landfall last night on the Yucatan Peninsula as a Category 1 hurricane. It is over the Gulf of Mexico as a tropical storm. Here is the latest from the National Hurricane Center (NHC) as of 10:00 PM CDT.
000
WTNT33 KNHC 280254
TCPAT3

BULLETIN
Tropical Storm Zeta Advisory Number  14
NWS National Hurricane Center Miami FL       AL282020
1000 PM CDT Tue Oct 27 2020

...ZETA FORECAST TO BE A FAST-MOVING HURRICANE THAT BRINGS A
LIFE-THREATENING STORM SURGE AND STRONG WINDS, STARTING IN
SOUTHEASTERN LOUISIANA BY MIDDAY WEDNESDAY...


SUMMARY OF 1000 PM CDT...0300 UTC...INFORMATION
-----------------------------------------------
LOCATION...23.8N 91.2W
ABOUT 390 MI...625 KM SSW OF THE MOUTH OF THE MISSISSIPPI RIVER
ABOUT 435 MI...695 KM S OF NEW ORLEANS LOUISIANA
MAXIMUM SUSTAINED WINDS...70 MPH...110 KM/H
PRESENT MOVEMENT...NW OR 325 DEGREES AT 15 MPH...24 KM/H
MINIMUM CENTRAL PRESSURE...990 MB...29.24 INCHES


WATCHES AND WARNINGS
--------------------
CHANGES WITH THIS ADVISORY:

None

SUMMARY OF WATCHES AND WARNINGS IN EFFECT:

A Storm Surge Warning is in effect for...
* Mouth of the Atchafalaya River to Navarre Florida
* Lake Borgne, Lake Pontchartrain, Pensacola Bay and Mobile Bay

A Hurricane Warning is in effect for...
* Morgan City Louisiana to the Mississippi/Alabama border
* Lake Pontchartrain, Lake Maurepas, and Metropolitan New Orleans

A Tropical Storm Warning is in effect for...
* Mississippi/Alabama border to Okaloosa/Walton County Line Florida

A Tropical Storm Watch is in effect for...
* West of Morgan City to Intracoastal City Louisiana

A Storm Surge Warning means there is a danger of life-threatening
inundation, from rising water moving inland from the coastline,
during the next 36 hours in the indicated locations. For a depiction
of areas at risk, please see the National Weather Service Storm
Surge Watch/Warning Graphic, available at hurricanes.gov.  This is a
life-threatening situation.  Persons located within these areas
should take all necessary actions to protect life and property from
rising water and the potential for other dangerous conditions.
Promptly follow evacuation and other instructions from local
officials.

A Hurricane Warning means that hurricane conditions are expected
somewhere within the warning area.  Preparations to protect life and
property should be rushed to completion.

A Tropical Storm Warning means that tropical storm conditions are
expected somewhere within the warning area within 36 hours.

A Tropical Storm Watch means that tropical storm conditions are
possible within the watch area, generally within 48 hours.

For storm information specific to your area, including possible
inland watches and warnings, please monitor products issued by your
local National Weather Service forecast office.


DISCUSSION AND OUTLOOK
----------------------
At 1000 PM CDT (0300 UTC), the center of Tropical Storm Zeta was
located near latitude 23.8 North, longitude 91.2 West. Zeta is
moving toward the northwest near 15 mph (24 km/h). A turn toward the
north is expected overnight, and a faster northward to
north-northeastward motion is expected on Wednesday.  On the
forecast track, the center of Zeta will move over the central Gulf
of Mexico overnight.  Zeta is forecast to make landfall in
southeastern Louisiana Wednesday afternoon, move close to the
Mississippi coast Wednesday evening, and move across the
southeastern and eastern United States on Thursday.

Maximum sustained winds have increased to near 70 mph (110 km/h)
with higher gusts.  Zeta is forecast to become a hurricane again
overnight and reach the northern Gulf Coast Wednesday as a
hurricane on Wednesday afternoon before weakening over the
southeastern United States on Thursday.

Tropical-storm-force winds extend outward up to 140 miles (220 km)
from the center.

The latest minimum central pressure reported by an Air Force
Reserve Hurricane Hunter aircraft is 990 mb (29.23 inches).


HAZARDS AFFECTING LAND
----------------------
Key messages for Zeta can be found in the Tropical Cyclone
Discussion under AWIPS header MIATCDAT3, WMO header WTNT43 KNHC, and
on the web at www.hurricanes.gov/text/MIATCDAT3.shtml.

STORM SURGE:  Along the northern Gulf Coast, the combination of a
dangerous storm surge and the tide will cause normally dry areas
near the coast to be flooded by rising waters moving inland from the
shoreline.  The water could reach the following heights above ground
somewhere in the indicated areas if the peak surge occurs at the
time of high tide...

Mouth of the Pearl River to Dauphin Island AL...5-8 ft
Port Fourchon LA to the Mouth of the Pearl River including Lake
Borgne...4-6 ft
Dauphin Island AL to AL/FL border including Mobile Bay...3-5 ft
Mouth of the Atchafalaya River to Port Fourchon LA...2-4 ft
AL/FL border to Navarre FL including Pensacola Bay...2-4 ft
Lake Pontchartrain...2-4 ft
Intracoastal City LA to the Mouth of the Atchafalaya River
including Vermilion Bay...1-3 ft
Navarre FL to Yankeetown FL including Choctawhatchee Bay and Saint
Andrew Bay...1-3 ft

The deepest water will occur along the immediate coast near and to
the right of the landfall location, where the surge will be
accompanied by large and dangerous waves.  Surge-related flooding
depends on the relative timing of the surge and the tidal cycle,
and can vary greatly over short distances.  For information
specific to your area, please see products issued by your local
National Weather Service forecast office.

WIND:  Hurricane conditions are expected within the Hurricane
Warning area on the northern Gulf Coast Wednesday afternoon, with
tropical storm conditions beginning Wednesday morning.  Tropical
storm conditions are expected within the Tropical Storm Warning
area on the northern Gulf Coast by late Wednesday, and tropical
storm conditions are possible within the Tropical Storm Watch area
Wednesday afternoon.

Damaging winds, especially in gusts, will spread well inland across
portions of southeast Mississippi and southern Alabama Wednesday
night.

RAINFALL: Locally heavy rains in advance of Zeta will continue to
expand and move north from the central Gulf Coast tonight through
Wednesday, eventually affecting the Ohio Valley to the central
Appalachians Wednesday night and Thursday. Meanwhile, the core of
heavy rains near Zeta will track from the central Gulf Coast to the
Mid-Atlantic late Wednesday through late Thursday. Rainfall totals
of 2 to 4 inches with isolated amounts of 6 inches are expected
across these areas, resulting in flash, urban, small stream, and
minor river flooding.

Zeta may produce an additional 1 to 2 inches of rain
across portions of western Cuba and the northern Yucatan Peninsula
through the rest of tonight.

TORNADOES:  A few tornadoes are expected Wednesday afternoon into
Wednesday night over southeastern portions of Louisiana and
Mississippi, southern Alabama, and the western Panhandle of Florida.


NEXT ADVISORY
-------------
Next intermediate advisory at 100 AM CDT.
Next complete advisory at 400 AM CDT.

$$
Forecaster Blake
Where does Zeta go? Here is a heat map of forecast models of where Zeta could go in the next few days. All forecast models are from National Center for Atmospheric Research (NCAR). The heat is generated by QGIS. The heat map use points within 300 mile/480 kilometers radius. I used the latest forecast, which is 0000Z.
Most forecast models have Zeta heading towards New Orleans. Some have it heading towards Mississippi and Alabama. Texas looks less likely to be impacted by Zeta. It seems like Louisiana cannot catch a break from tropical weather lately. How strong will Zeta be?
Most forecast models keep Zeta as a strong tropical storm. One has it as a Category 1 hurricane. I think Zeta will be a Category 1 hurricane. I would not be surprised if it weakens to tropical storm before landfall somewhere along the Gulf Coast.
Zeta adds a lot of uncertainty and craziness with winter weather and COVID-19 pandemic.
NOAA/NESDIS/STAR GOES ABI BAND 14 OR_ABI-L1b-RadC-M6C14_G16_s20203010341162_e20203010343535_c20203010344070.nc
We have another hurricane in the Caribbean. It is now Zeta. This gives a sense of deja vu. Hurricane Delta formed in the same area before it ravaged Southwest Louisiana earlier this month. This is on top of the COVID-19 pandemic. There are 43 million confirmed cases of COVID-19 worldwide. The pandemic has made life stressful for everyone. Here is the latest from the National Hurricane Center (NHC) as of 11:10 PM CDT. It just made lnadfall.
000
WTNT63 KNHC 270413
TCUAT3

Hurricane Zeta Tropical Cyclone Update
NWS National Hurricane Center Miami FL       AL282020
1110 PM CDT Mon Oct 26 2020

...ZETA MAKES LANDFALL ALONG THE COAST OF THE YUCATAN PENINSULA
OF MEXICO JUST NORTH OF TULUM...

Satellite imagery and surface observations from Mexico indicate that
the center of Hurricane Zeta made landfall along the northeast coast
of the Yucatan peninsula of Mexico near Ciudad Chemuyil around 11:00
PM CDT (0400 UTC) with estimated maximum winds of 80 mph (130 km/h),
a category one hurricane on the Saffir-Simpson Hurricane Wind Scale.

A WeatherFlow observing site just south of Ciudad Chemuyil recently
reported a pressure of 978 mb (28.88 inches).

A WeatherFlow observing site just south of Playa del Carmen recently
reported a sustained one-minute wind of 74 mph (119 km/h) and a gust
to 87 mph (140 km/h).

A WeatherFlow observing site in Cancun recently reported a wind
gust to 79 mph (127 km/h).


SUMMARY OF 1100 PM CDT...0400 UTC...INFORMATION
----------------------------------------------
LOCATION...20.4N 87.4W
ABOUT 15 MI...25 KM NNE OF TULUM MEXICO
MAXIMUM SUSTAINED WINDS...80 MPH...130 KM/H
PRESENT MOVEMENT...NW OR 305 DEGREES AT 13 MPH...20 KM/H
MINIMUM CENTRAL PRESSURE...977 MB...28.85 INCHES

$$
Forecaster Brown/Stewart
Zeta is a Category 1 hurricane with 80 mph winds. Where does Zeta go from there? Here is a heat map of forecast models of where Zeta could go in the next few days. All forecast models are from National Center for Atmospheric Research (NCAR). The heat is generated by QGIS. The heat map use points within 300 mile/480 kilometers radius. I used the latest forecast, which is 0000Z.
Most of the forecast models at this time have it heading towards Southeast Louisiana. It seems like every forecast model have hurricanes hitting Louisiana. Texas has a small chance of getting hit by Zeta. The forecast model is subject to change. That leads to the next question, how strong will Zeta be?
Most forecast models have Zeta as a Category 1 hurricane in the Gulf of Mexico. One model has it as a Category 2 hurricane. I would not be surprised if Zeta intensifies into a Category 2 or even 3 hurricane. Hopefully, it will not be the case.
We will need to keep an eye on Zeta. It could be a problem for the Gulf of Mexico.
2020 has been a crazy year ranging from COVID-19 pandemic to hurricanes. Hurricane Delta is now the third major hurricane of the 2020 season. Here is the latest advisory from the National Hurricane Center (NHC).
326
WTNT31 KNHC 070247
TCPAT1

BULLETIN
Hurricane Delta Advisory Number  10
NWS National Hurricane Center Miami FL       AL262020
1000 PM CDT Tue Oct 06 2020

...EXTREMELY DANGEROUS HURRICANE DELTA CONTINUES HEADING TOWARD THE
NORTHEAST COAST OF THE YUCATAN PENINSULA...
...EXPECTED TO BRING A LIFE-THREATENING STORM SURGE AND EXTREME
WINDS...


SUMMARY OF 1000 PM CDT...0300 UTC...INFORMATION
-----------------------------------------------
LOCATION...19.5N 85.1W
ABOUT 135 MI...220 KM ESE OF COZUMEL MEXICO
MAXIMUM SUSTAINED WINDS...130 MPH...215 KM/H
PRESENT MOVEMENT...WNW OR 300 DEGREES AT 16 MPH...26 KM/H
MINIMUM CENTRAL PRESSURE...960 MB...28.35 INCHES


WATCHES AND WARNINGS
--------------------
CHANGES WITH THIS ADVISORY:

None.

SUMMARY OF WATCHES AND WARNINGS IN EFFECT:

A Hurricane Warning is in effect for...
* Tulum to Dzilam Mexico
* Cozumel

A Tropical Storm Warning is in effect for...
* Cuba province of Pinar del Rio
* Isle of Youth
* Punta Herrero to Tulum Mexico
* Dzilam to Progreso Mexico

A Hurricane Warning means that hurricane conditions are expected
somewhere within the warning area.  Preparations to protect life
and property should be rushed to completion.

A Tropical Storm Warning means that tropical storm conditions are
expected somewhere within the warning area within 36 hours.

Interests along the northern Gulf of Mexico coast should monitor
the progress of Delta.  Hurricane and Storm Surge Watches will
likely be issued for a portion of this area on Wednesday.

For storm information specific to your area, please monitor
products issued by your national meteorological service.


DISCUSSION AND OUTLOOK
----------------------
At 1000 PM CDT (0300 UTC), the center of Hurricane Delta was located
near latitude 19.5 North, longitude 85.1 West.  Delta is moving
toward the west-northwest near 16 mph (26 km/h).   A
west-northwestward to northwestward motion is expected over the
next day or so.  A slower northwestward to north-northwestward
motion is forecast to begin on Thursday, and a northward motion is
expected Thursday night and Friday.  On the forecast track, the
center of Delta will move over the northeastern portion of the
Yucatan Peninsula early Wednesday.  Delta is forecast to move over
the southern Gulf of Mexico Wednesday afternoon, be over the
southern or central Gulf of Mexico through Thursday, and approach
the northern Gulf coast on Friday.

Maximum sustained winds are near 130 mph (215 km/h) with higher
gusts.  Delta is a category 4 hurricane on the Saffir-Simpson
Hurricane Wind Scale.  Little change in strength is expected
before the center reaches the coast of the Yucatan peninsula early
Wednesday.  Although some weakening is likely when Delta moves over
the Yucatan peninsula, re-strengthening is forecast when the
hurricane moves over the southern Gulf of Mexico Wednesday night
and Thursday.

Hurricane-force winds extend outward up to 30 miles (45 km) from the
center and tropical-storm-force winds extend outward up to 105 miles
(165 km).  NOAA buoy 42056 recently measured a sustained wind of
65 mph (104 km/h) and a gust to 76 mph (122 km/h).

The estimated minimum central pressure is 960 mb (28.35 inches).


HAZARDS AFFECTING LAND
----------------------
Key messages for Delta can be found in the Tropical Cyclone
Discussion under AWIPS header MIATCDAT1, WMO header WTNT41
KNHC, and on the web at www.hurricanes.gov/text/MIATCDAT1.shtml.

STORM SURGE:  A life-threatening storm surge will raise water levels
in areas of onshore winds by as much as 9 to 13 ft above normal tide
levels along the northern coast of the Yucatan Peninsula from Cabo
Catoche to Progresso, and 6 to 9 ft above normal tide levels along
the eastern coast of the Yucatan Peninsula from Tulum to Cabo
Catoche.  Near the coast, the surge will be accompanied by large
and destructive waves.

WIND:  In the Yucatan Peninsula, potentially catastrophic
hurricane conditions are expected in portions of the warning area
early Wednesday, with tropical storm conditions beginning
overnight.  Tropical storm conditions are expected in the tropical
storm warning area later tonight and Wednesday.  In Cuba, tropical
storm conditions are expected tonight in the warning area.

RAINFALL:  Delta is expected to produce 4 to 6 inches of rain, with
isolated maximum totals of 10 inches, across portions of the
northern Yucatan Peninsula through midweek. This rainfall may result
in areas of significant flash flooding.

Over the next few days, Delta is expected to produce 2 to 4 inches
of rain, with isolated higher amounts, across portions of the Cayman
Islands and western Cuba.  This rainfall may result in areas of
flash flooding and mudslides.

Later this week, Delta is expected to produce 4 to 8 inches of rain,
with isolated maximum totals of 12 inches, over portions of the
central Gulf Coast.  These rainfall amounts may lead to flash,
urban and minor river flooding. Heavy rainfall will eventually
spread into the Tennessee Valley, and interior southeastern United
States as well.

SURF:  Swells generated by Delta will affected land areas around
the northwestern Caribbean Sea for the next day or so. These swells
are likely to cause life-threatening surf and rip current
conditions.  Please consult products from your local weather office.


NEXT ADVISORY
-------------
Next intermediate advisory at 100 AM CDT.
Next complete advisory at 400 AM CDT.

$$
Forecaster Pasch
Delta has weaken to 130 mph, which is still a dangerous Category 4 hurricane. How strong could Delta be?
All intensity forecast and projections are from NCAR-Tropical Cyclone Guidance. Here is the most recent intensity forecast model.
Most forecast model weaken Delta before it makes landfall on Yucatan Peninsula. Some further intensify Delta. A couple have Delta as a Category 5 hurricane. I think Delta has a chance of becoming a Category 5 hurricane. The water where Delta is very warm. It is the warmest in the Atlantic Basin. The map is from Tropical Cyclone Heat Potential map of the Gulf of Mexico from NOAA.
The warm water goes deep, so Delta can use a lot of warm water to further intensify. I would not be surprised if Delta intensifies later tonight. The next big question is where does Delta go? Here is a heat map using points within 300 mile/480 kilometers radius. I used the latest forecast, which is 0000Z. All GIS maps are created from QGIS.
Most forecast models have Delta making landfall on Yucatan Peninsula. It is possible that Delta could go over the Yucatan Channel. Most forecast models have it going over the Western Gulf of Mexico. Where Delta goes is hard to say at this time. It could make landfall from Texas, Louisiana, Mississippi, Alabama, and Florida.
Hurricane Delta needs to be watched for the next few days.
Tropical Storm Beta has made landfall sometimes around 10:00 PM CDT. As of 11:00 PM CDT, Beta has 45 mph winds. It is from the National Hurricane Center (NHC).
000
WTNT62 KNHC 220401
TCUAT2
Tropical Storm Beta Tropical Cyclone Update
NWS National Hurricane Center Miami FL AL222020
1100 PM CDT Mon Sep 21 2020
…CENTER OF BETA CROSSES THE TEXAS COAST NEAR THE SOUTHERN END OF
MATAGORDA PENINSULA…
Surface observations received after the issuance of the previous
advisory indicate that Beta’s center crossed the Texas coast near
the southern end of Matagorda Peninsula around 10 PM CDT.
SUMMARY OF 1100 PM CDT…0400 UTC…INFORMATION
———————————————-
LOCATION…28.5N 96.4W
ABOUT 5 MI…10 KM N OF PORT OCONNOR TEXAS
ABOUT 25 MI…40 KM WSW OF MATAGORDA TEXAS
MAXIMUM SUSTAINED WINDS…45 MPH…75 KM/H
PRESENT MOVEMENT…NW OR 325 DEGREES AT 3 MPH…6 KM/H
MINIMUM CENTRAL PRESSURE…999 MB…29.50 INCHES
$$
Forecaster Berg
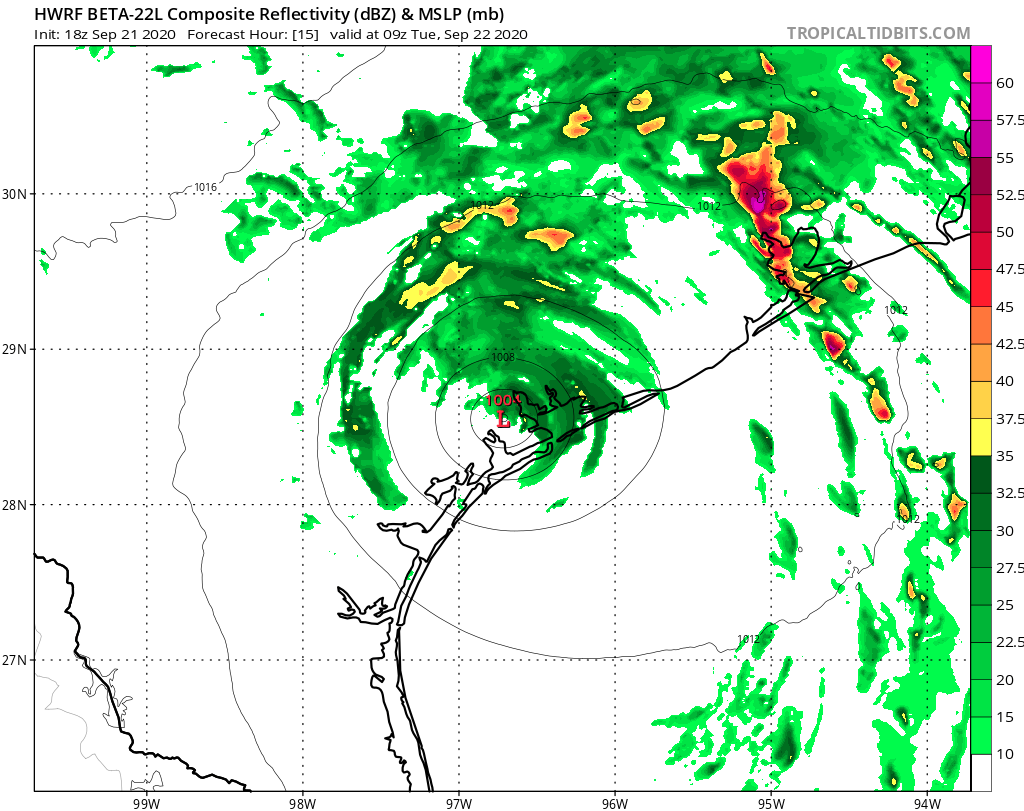
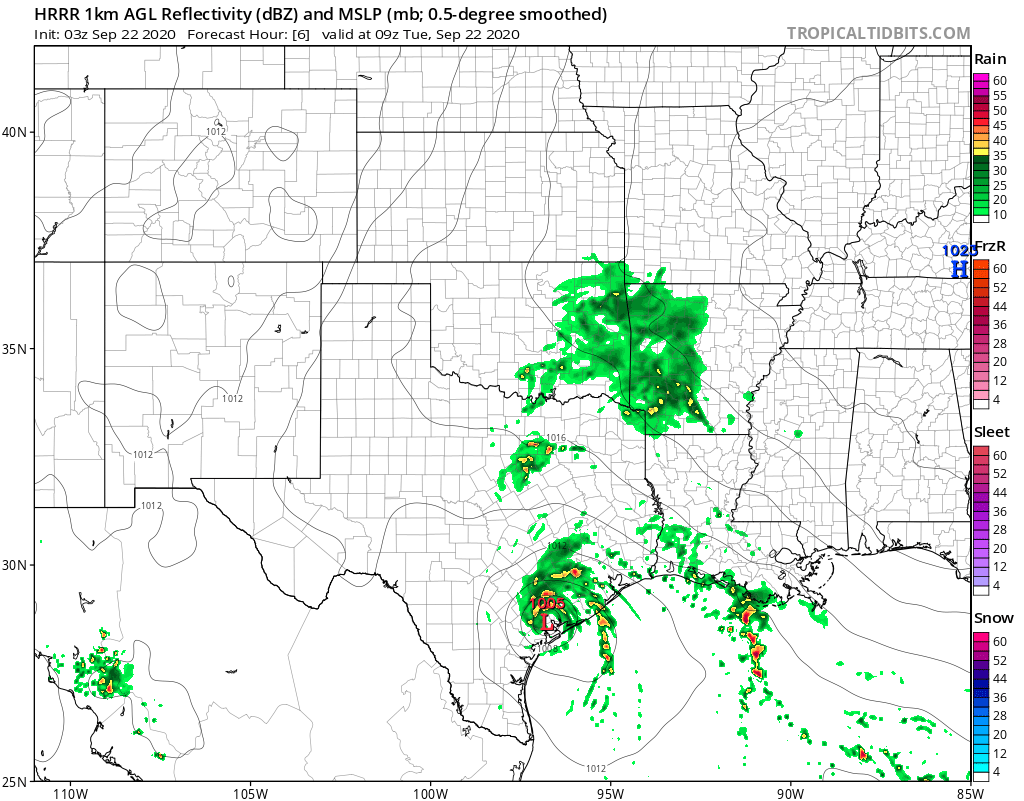
Many are wondering what will Beta do later tonight as it is a slow mover. Here are some forecast models from Tropical Tidbits. The forecast models are Hurricane Weather Research and Forecasting (HWRF), High-Resolution Rapid Refresh (HRRR), North American Mesoscale Forecast System (NAM), Regional Model (RGEM), and Weather Research and Forecast (WRF-ARW2). They are at 0900Z or 4:00 AM CDT.
HWRF
HRRR
NAM
RGEM
WRF-ARW2
HWRF and RGEM have heavy rain around 4:00 AM near the center. HRRR, NAM, and WRF-ARW2 do not forecast feeder bands near the center at 4:00 AM. HRRR, NAM, and WRF-ARW2 have more scattered rainfall instead of the more organized thunderstorms that HWRF and RGEM forecasts. With tropical systems or any warm core low pressure, they tend to have thunderstorms and heavy rain near the center at night. They can dump heavy rain over a short time and lead to flooding. It is more so when they are slow moving.
Regardless of those forecast models, I would not be surprised if we see core rains tonight. I do not know where it will happen. It will likely happen on the northeast side of Beta. There could be surprises. Core rains are notoriously difficult to forecast. Tomorrow could be problematic as Beta is likely to linger over Southeast Texas. I would be most concern of tonight and tomorrow night.