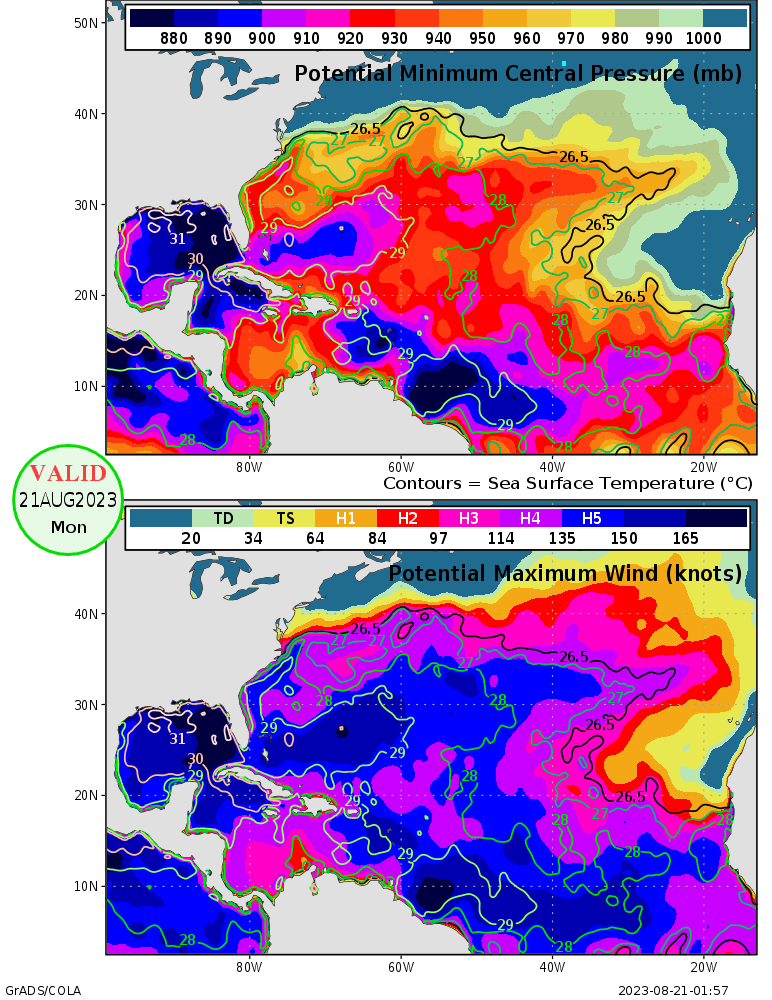
2024 has proven to be a turbulent year. Israel, Sudan, and Ukraine are engulfed in war. The 2020s have been a turbulent decade so far. Hurricane Season is coming as it starts on June 1, 2024. Here are other forecasts. ACE is short for Accumulated Cyclone Energy.
Colorado State University
23/11/5 ACE: 210
Joe Bastardi (Weather Bell)
25-30 Tropical Storms/14-16 Hurricanes/6-8 Major Hurricanes ACE: 200-240
Tropical Storm Risk
20/9/4 ACE: 160
Accuweather
20-25 Tropical Storms/8-12 Hurricanes/4-7 Major Hurricanes ACE: 175-225
Crown Weather
25/12/6 ACE: 225
The Weather Channel
24/11/6
Weather Tiger
20-24 Tropical Storms/9-12 Hurricanes/4-7 Major Hurricanes ACE: 160-225
University of Arizona
21/11/5 ACE: 156
North Carolina University
15-20 Tropical Storms/10-12 Hurricanes/3-4 Major Hurricanes
The analog years I am using are in which El Nino is fading away and going into La Nina. Obviously, the forecast is uncertain. In this case, I am more looking at Eastern Equatorial El Nino. I also take into account El Nino Modoki. The warmest water is in the Central to Western Pacific.
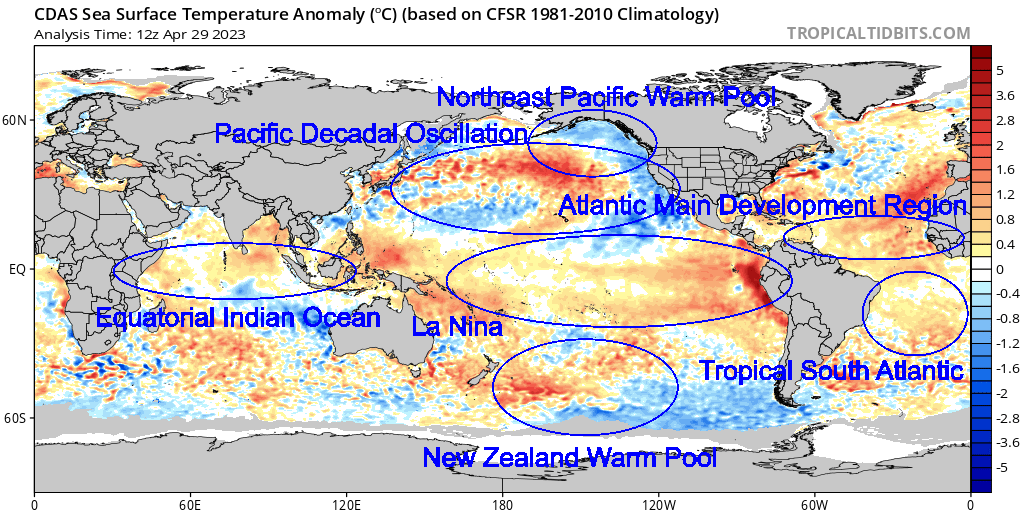
El Nino is not the only factor. I look at Atlantic Multidecadal Oscillation (AMO), Pacific Decadal Oscillation (PDO), Northeast Pacific Warm Pool (NEPWP), Equatorial Indian Ocean (EIO), Tropical South Atlantic (TSAI), New Zealand Warm Pool (NZWP), Quasi-Biennial Oscillation (QBO), Atlantic Main Development Region (MDR), Dipole Mode Index (DMI), and Tripole Index for the Interdecadal Pacific Oscillation (TPI IPO). Here is the ocean temperature anomaly map. It is from Tropical Tidbits.

Based on this, the analog years are 1897, 1926, 1931, 1958, 1977, 1983, 1995, 1998, 2005, 2007, 2010, 2016, and 2020
Analog Years For 2024 (TS/H/MH ACE ACE/Storm)
1897 (6/3/0 55 9.1)
1926 (11/8/6 230 20.9)
1931 (13/3/1 48 3.7)
1958 (12/7/3 110 9.1)
1977 (6/5/1 25 4.2)
1983 (4/3/1 17 4.4)
1995 (19/11/5 227 12.0)
1998 (14/10/3 182 13.0)
2005 (28/15/7 245 8.8)
2007 (15/6/2 74 4.9)
2010 (19/12/5 166 8.7)
2016 (15/7/4 141 9.4)
2020 (30/13/6 180 6.0)
All of the seasons had major hurricane with the exception of 1897. However, this is before satellite era. It is likely before satellites, the seasons were more active than what is recorded. Any season before satellite should be considered suspect. Even in satellite era, some data is rather questionable. The most active are 2005 and 2020. In terms of Accumulated Cyclone Energy (ACE), that goes to 2005 with ACE of 245. 1926 and 1995 are not far behind.
Here are notable storms in the analog seasons.
1897
Hurricane #1
Hurricane #2
Hurricane #5
1926
1926 Nassau Hurricane
Great Miami Hurricane Of 1926
Great Havana-Bermuda Hurricane Of 1926
1931
Tropical Storm #5
1931 British Honduras Hurricane
1958
Alma
Ella
Helene
1977
Anita
1983
Alicia
1995
Dean
Erin
Luis
Marilyn
Opal
Roxanne
1998
Charley
Earl
Francis
Georges
Mitch
2005
Dennis
Emily
Katrina
Rita
Stan
Vince
Wilma
Alpha
Beta
Gamma
Delta
2007
Dean
Erin
Felix
Humberto
Noel
2010
Alex
Hermine
Igor
Karl
Matthew
Nicole
2016
Earl
Matthew
Nicole
Otto
2020
Hanna
Laura
Sally
Teddy
Alpha
Beta
Delta
Zeta
Eta
Iota
The analog season have some memorable and deadly storms. Hurricane Mitch in 1998 dumped heavy rain over a large area of Central America. It led to massive flooding that claimed at least 12,000 lives. Mitch is the deadliest since the Great Hurricane of 1780. 1926 has the Great Miami Hurricane of 1926. It would likely be the costliest if it happened today. 1931 had the British Honduras Hurricane, which claimed over 2,500 lives. 1958 had Alma and Ella impact Texas with heavy rain and flooding. 1977 had Anita, which was a powerful Category 5 hurricane in the Gulf Of Mexico. Alicia ravaged Southeast Texas inn 1983. 1977 and 1983 were less active seasons. 1995 was an active season with Luis, Marilyn, Opal, and Roxanne. Besides Mitch, there was Georges, which was a long lived and dangerous hurricane. Charley and Francis dumped heavy rain on Texas. 2005 was a brutal year. It can be summed up with Katrina, Rita, Stan, and Wilma. New Orleans was flooded from levee failure, while Mississippi was utterly gutted by monster storm surge. Rita caused a scare in Texas before making landfall on Sabine Pass. Stan dumped heavy rain and flooding in Guatemala and Mexico. Wilma rapidly intensified into the most intense Atlantic hurricane known. Dean and Felix ravaged the Caribbean. Noel proved to be a disaster for Dominican Republic and Haiti. Texas had to contend with Erin and Humberto. Humberto formed quickly right before landfall a year to the day before Ike made landfall in 2008. 2010 had many storms form. Alex was a large storm that dumped heavy rain over Mexico and Texas. Igor was a monster hurricane that tracked across the Atlantic. 2016 had Matthew ravaged Haiti, Florida, and North Carolina with strong winds, heavy rain, and flooding. 2020 was active during the COVID pandemic. Laura and Delta ravaged Southwest Louisiana within weeks of each other. Zeta went over New Orleans as a Category 1 hurricane. Eta and Iota were cruel to Nicaragua. They made landfall weeks apart of each other. I am not suggesting 2024 will see another Great Miami Hurricane of 1926, 1931 British Honduras Hurricane, Alicia, Opal, Mitch, Katrina, Wilma, Dean, Alex, Matthew, Laura, or Iota.
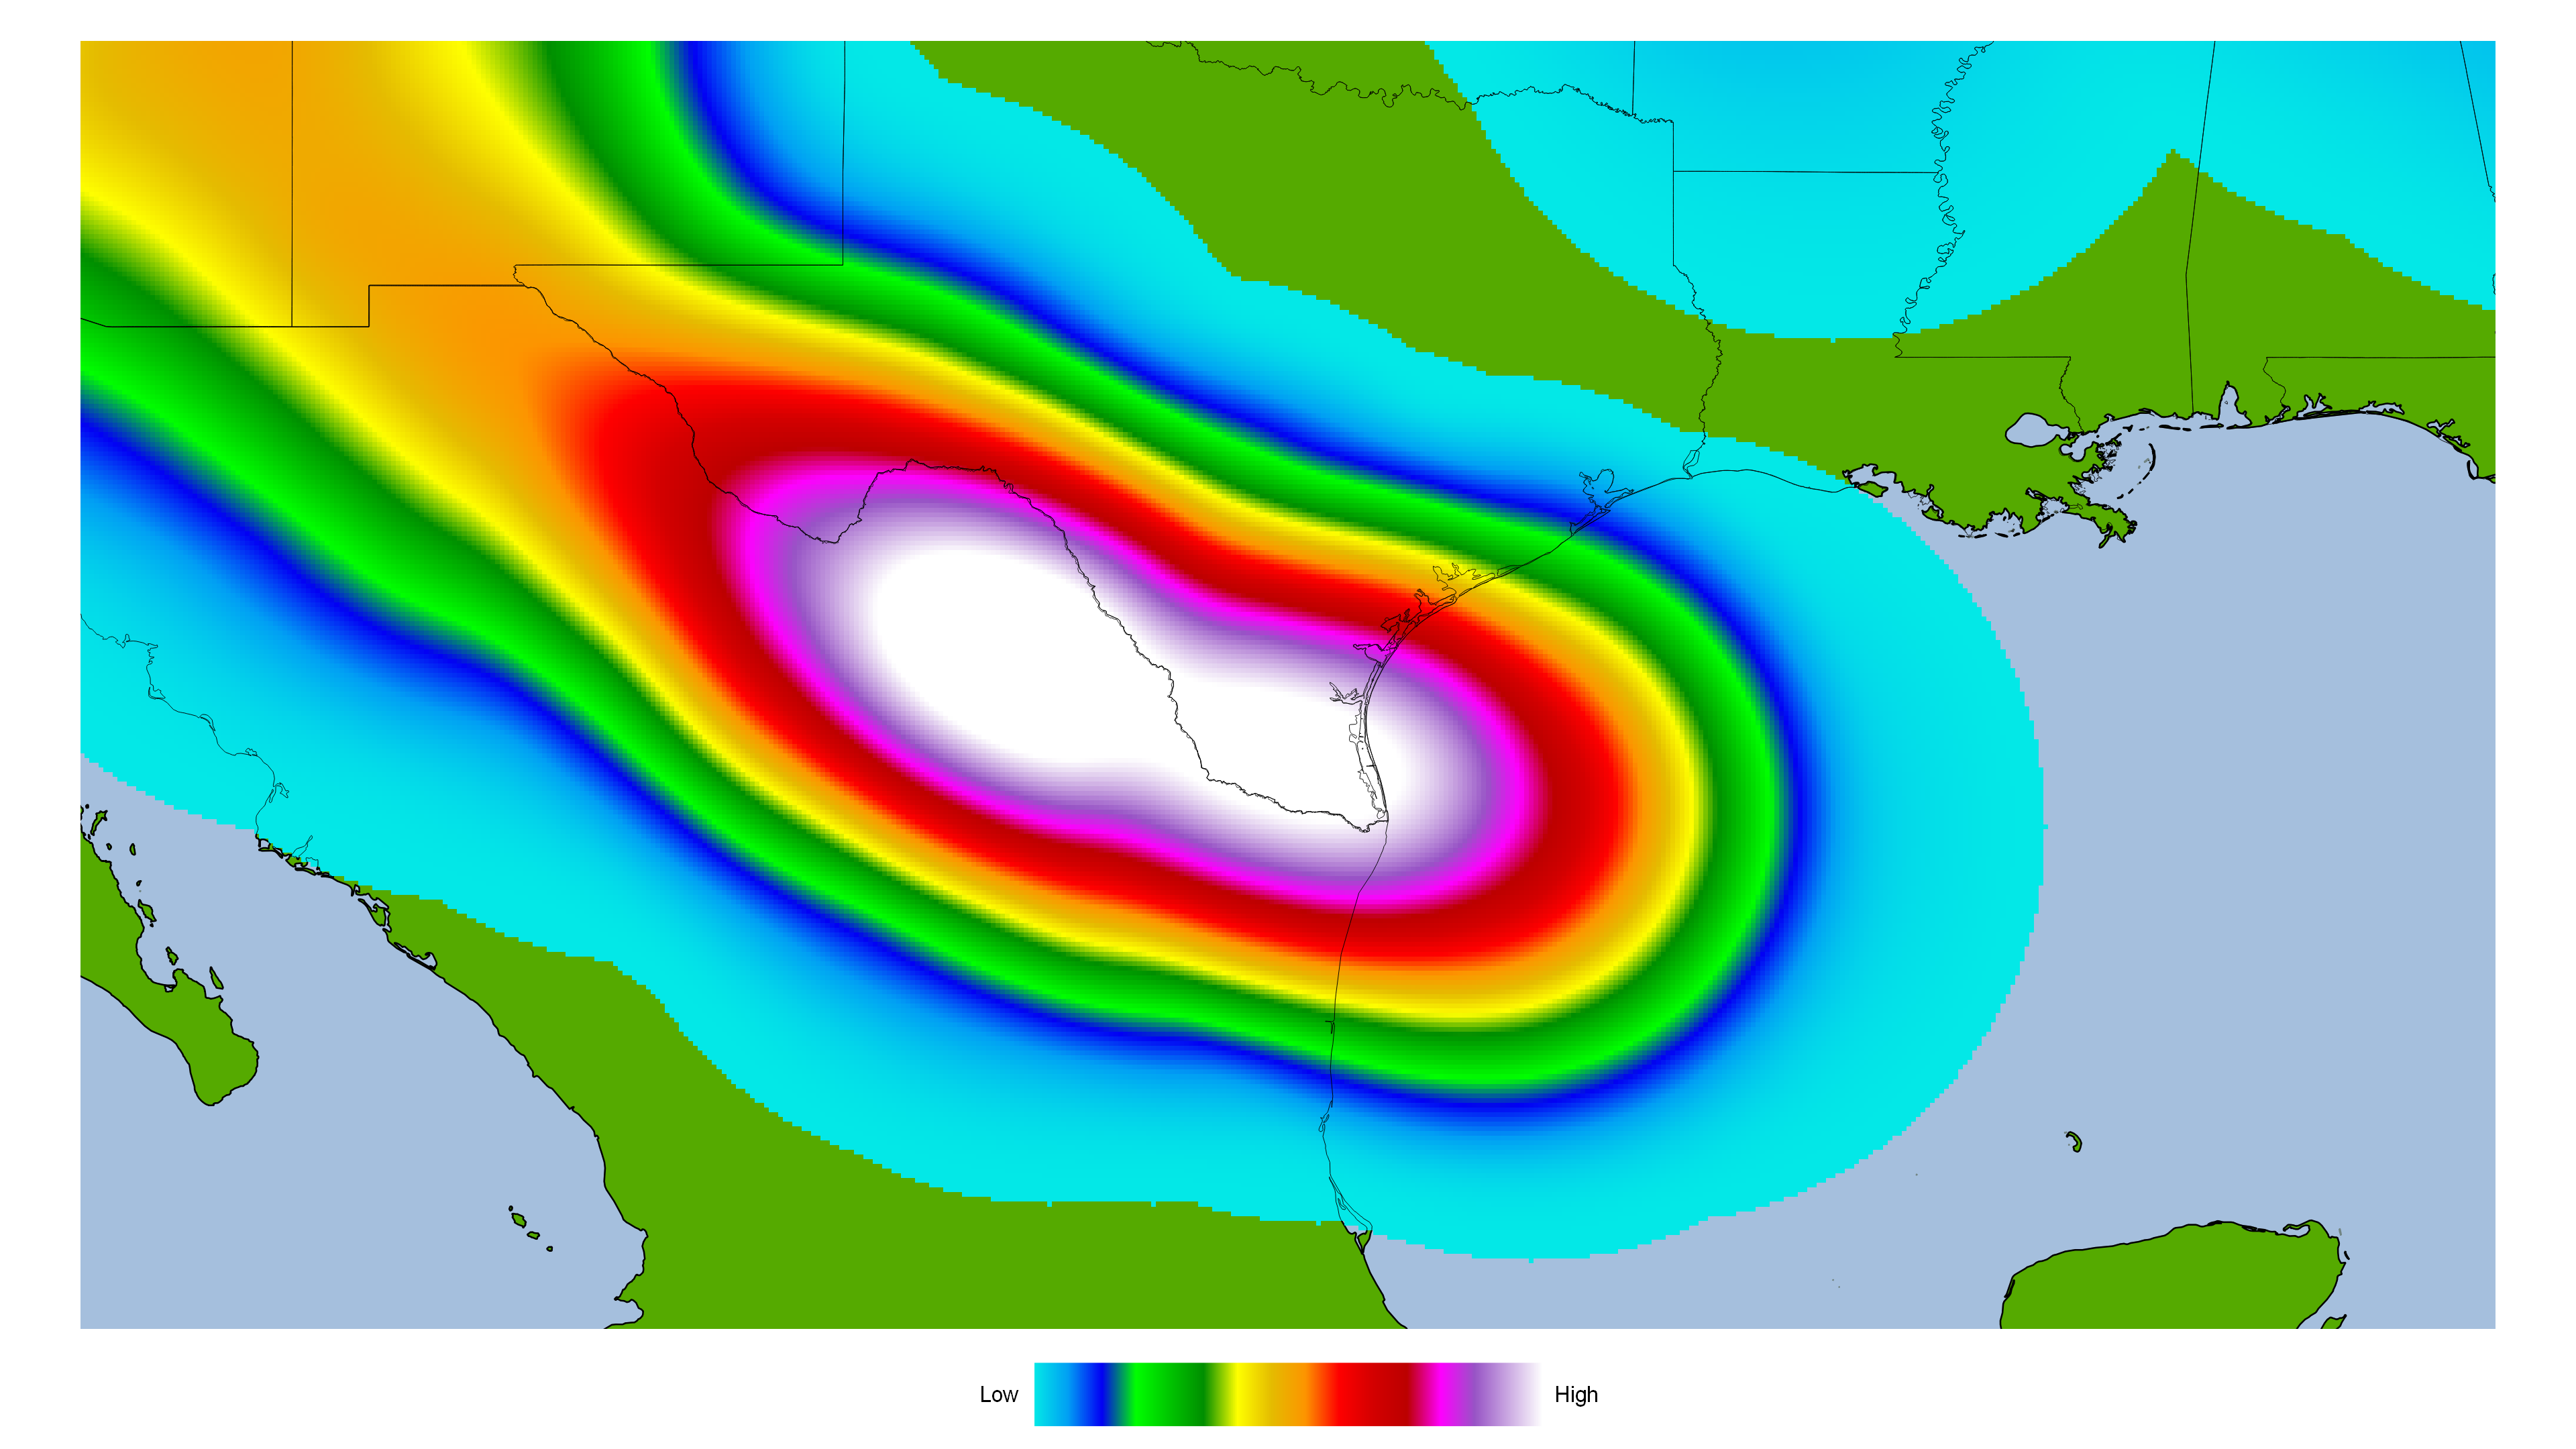
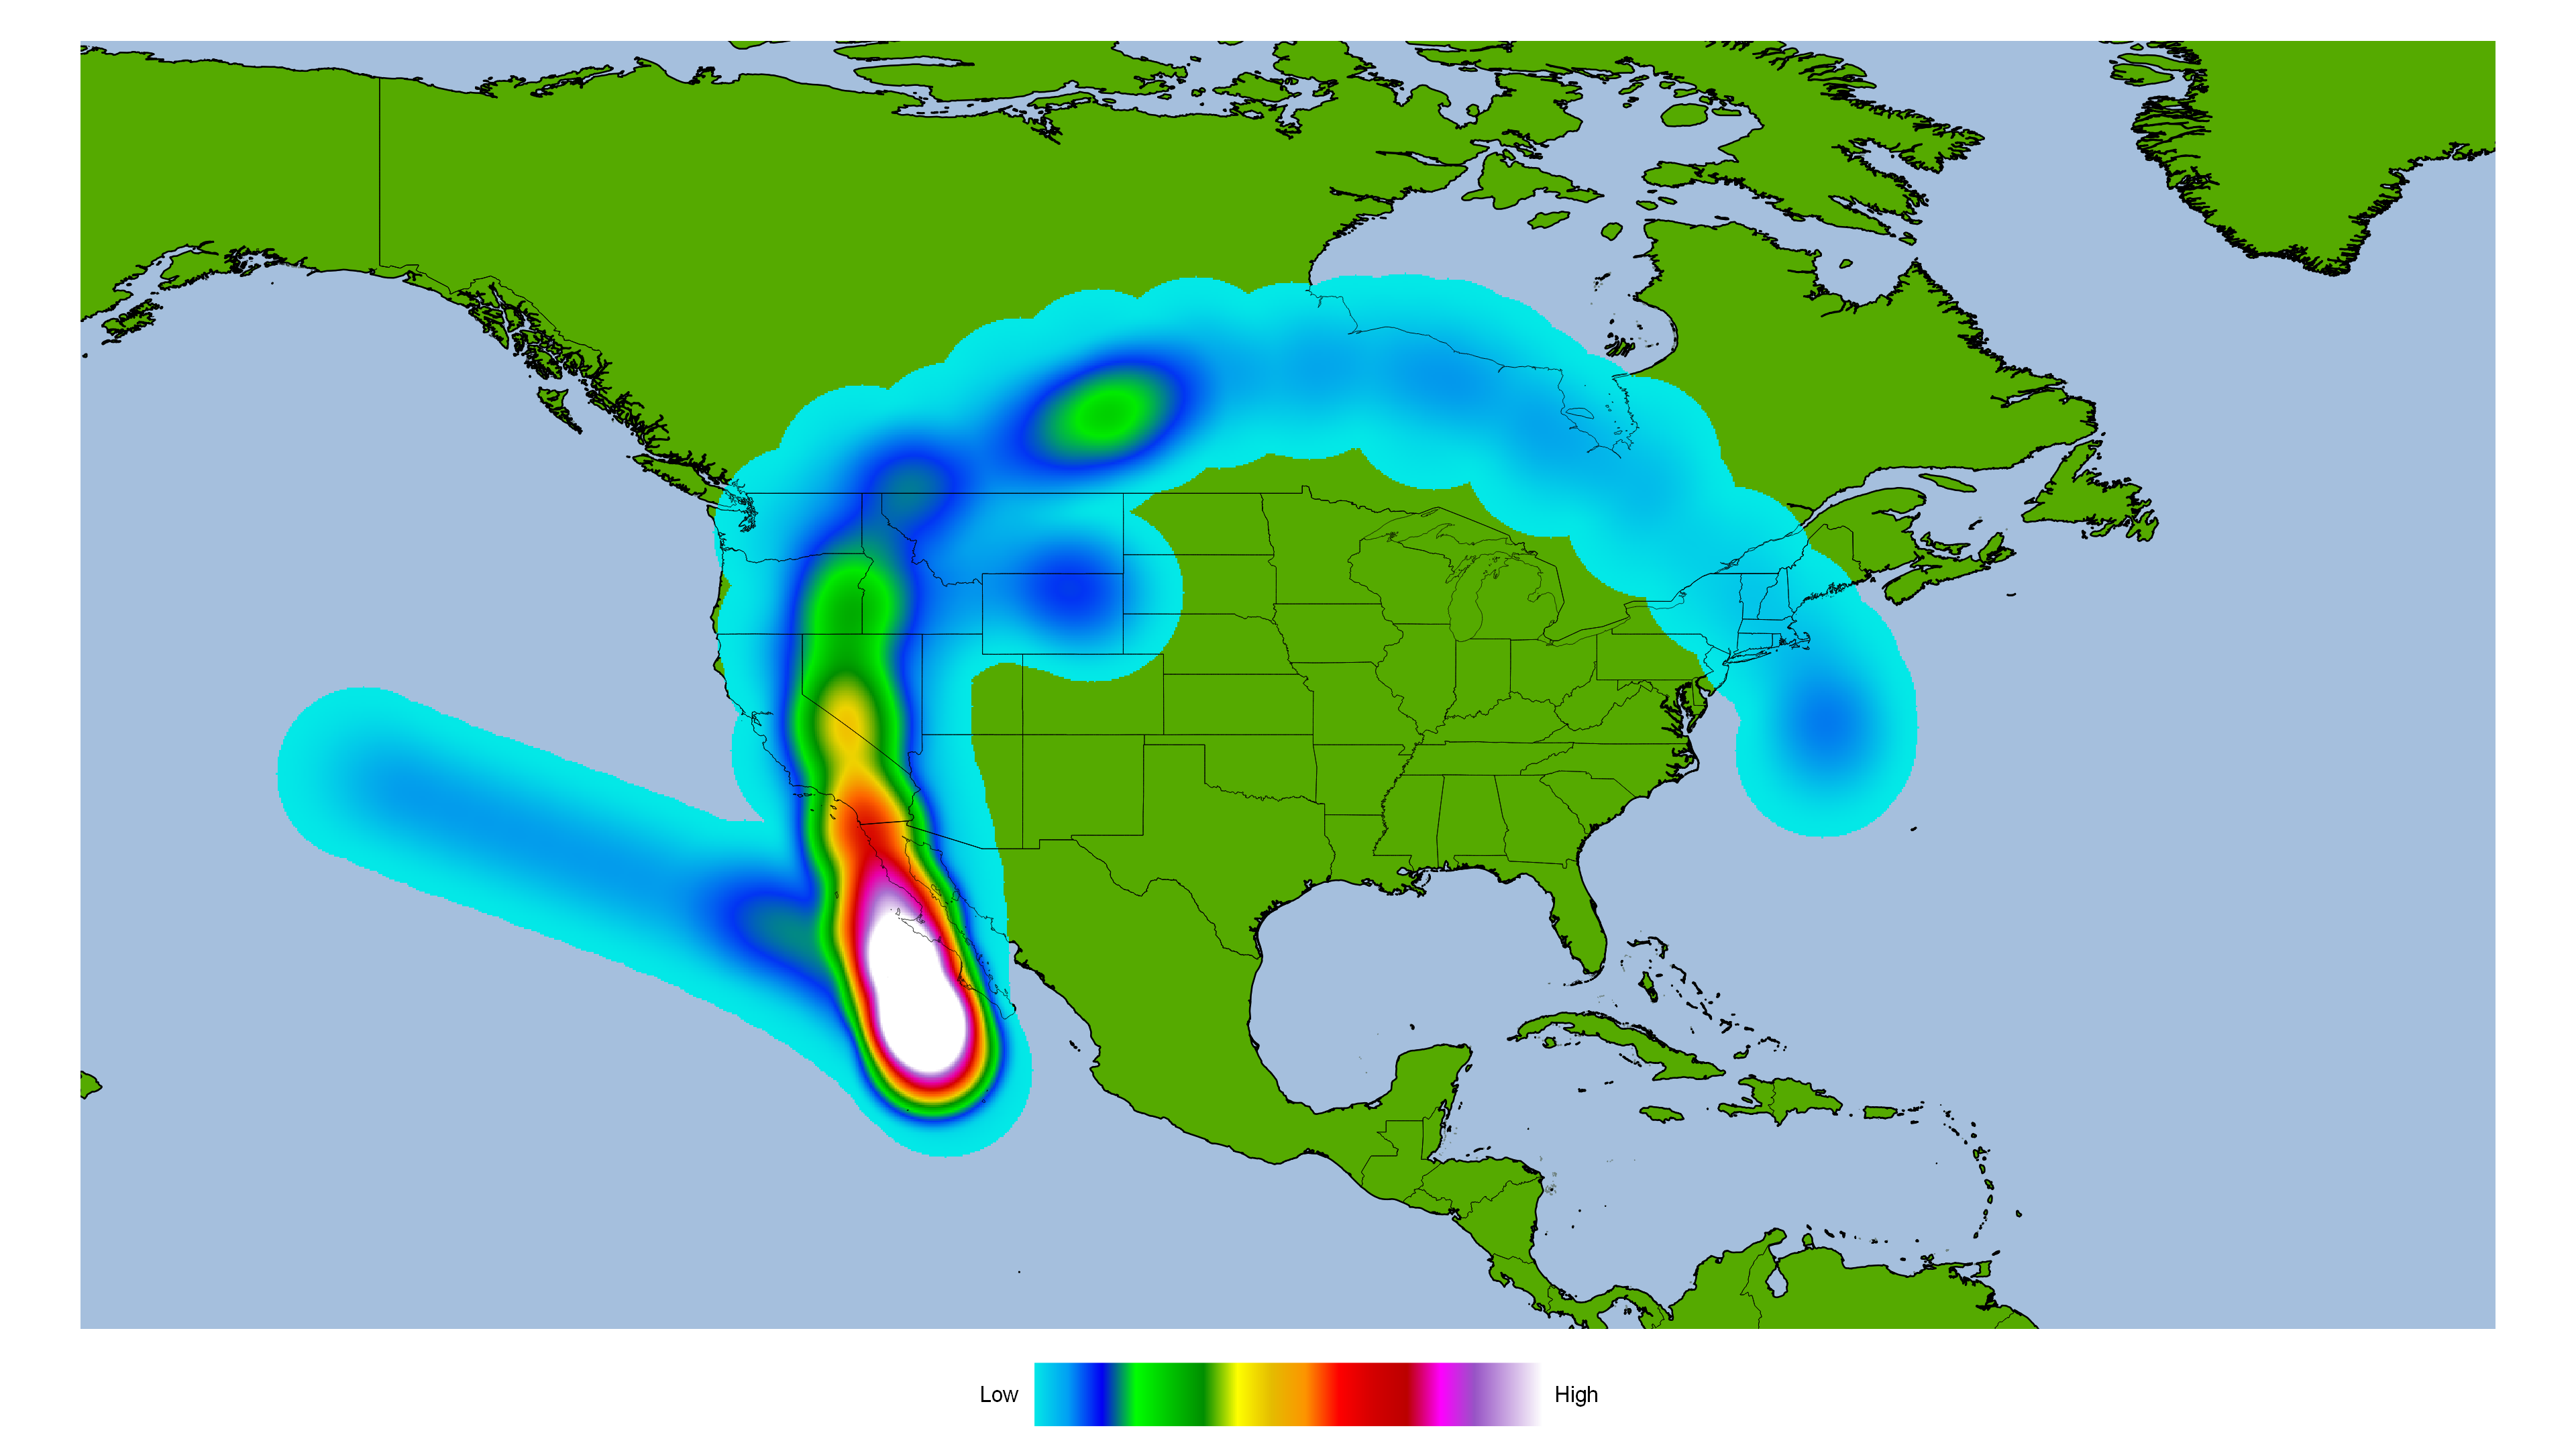
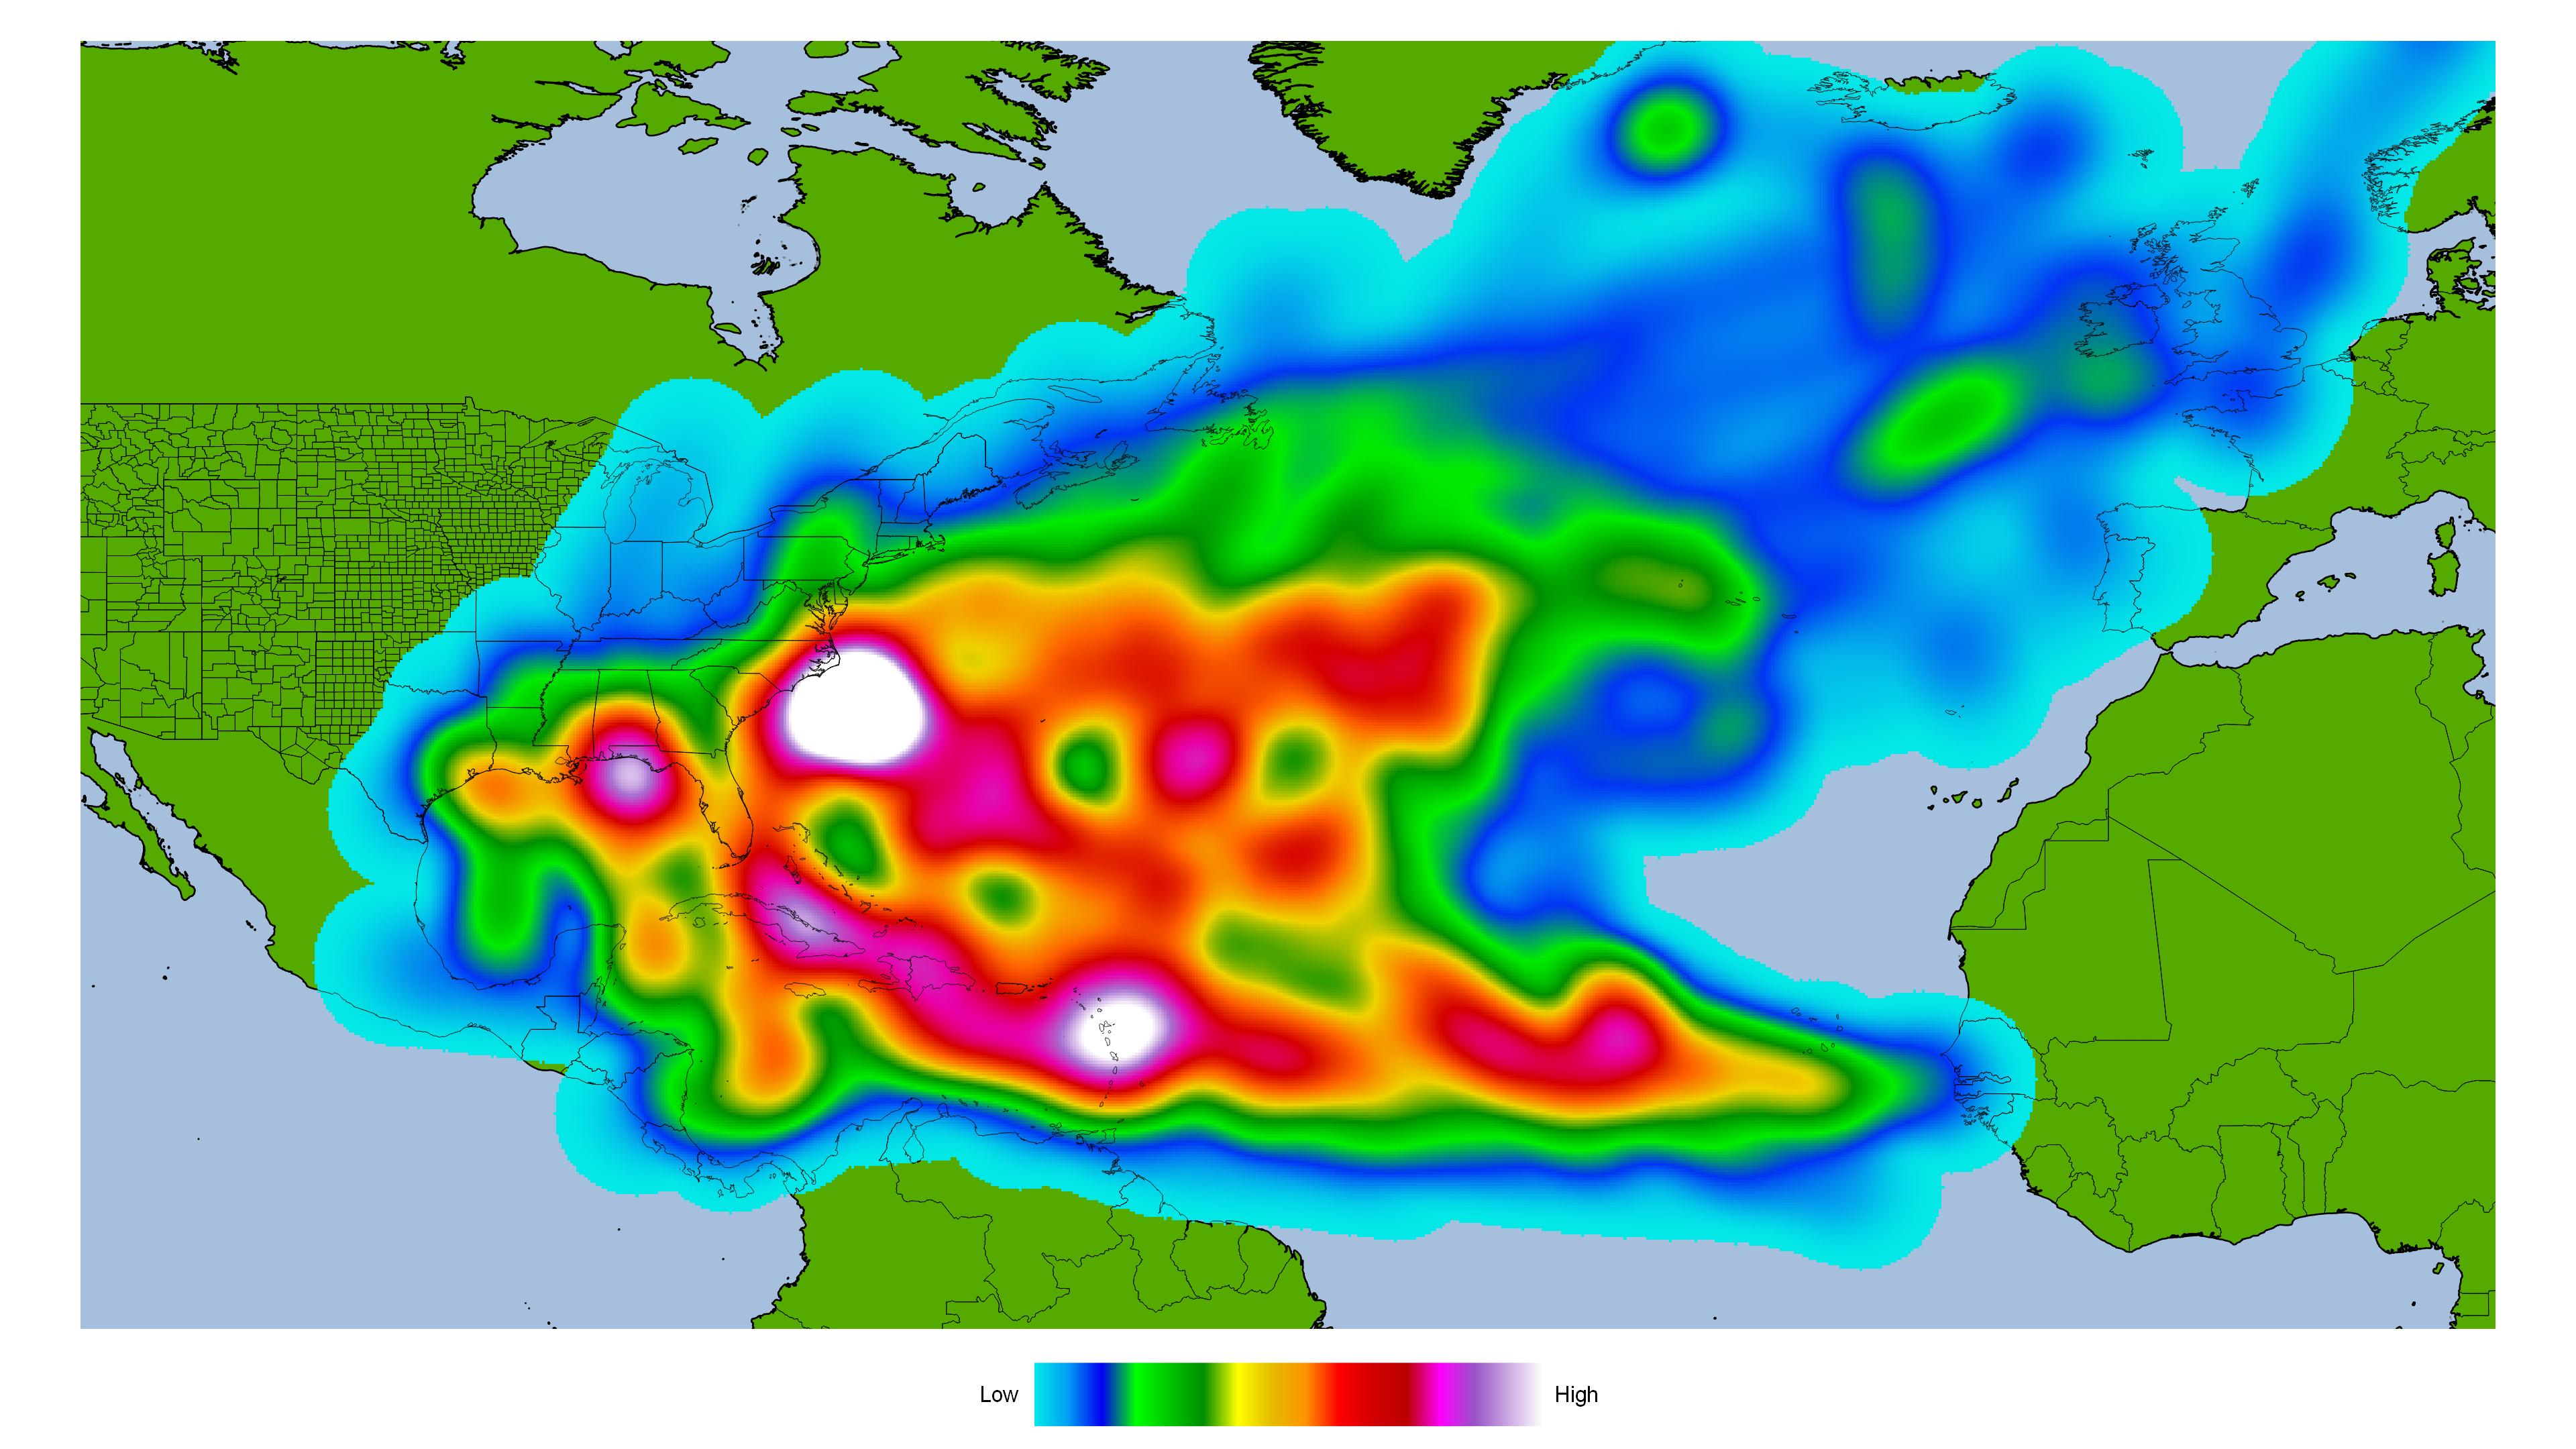
Here is a heat map of analog seasons. It is based on 300 mile radius from the storms. It was created with QGIS. The hurricane data came from International Best Track Archive for Climate Stewardship (IBTrACS).
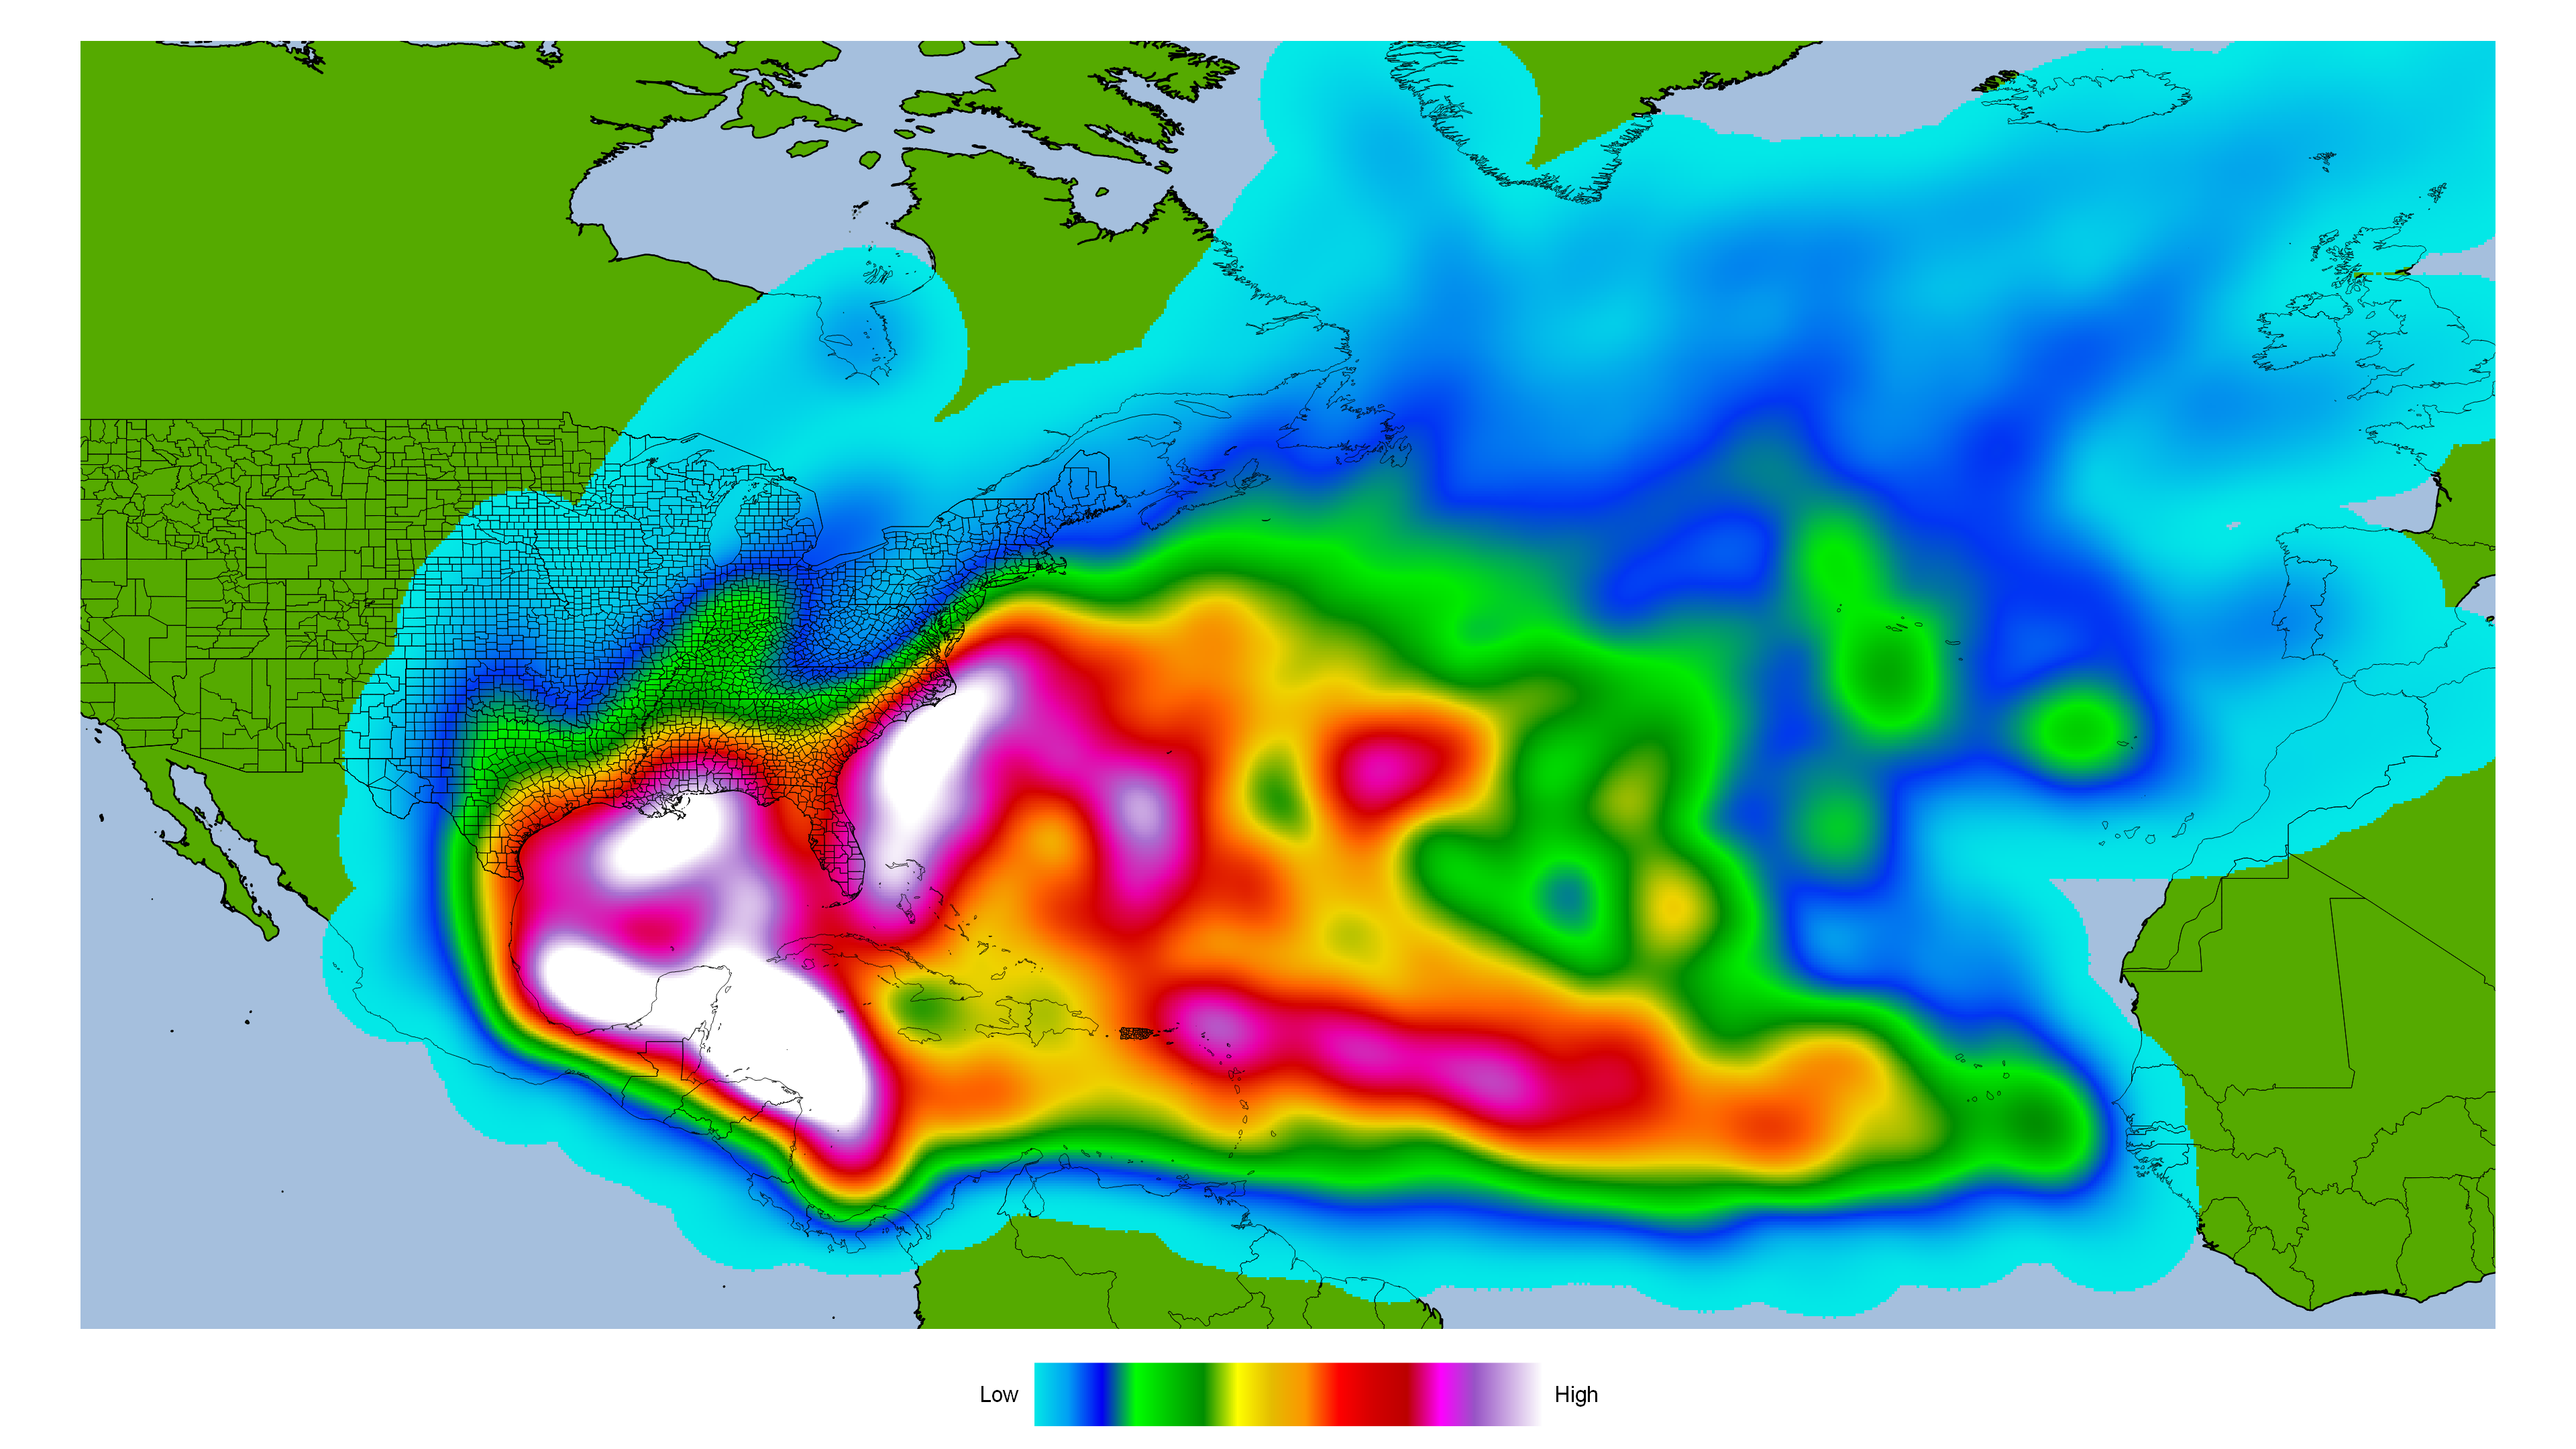
The Caribbean, Gulf Of Mexico, and Carolina Coasts look to have the most development. I never make landfall predictions. I strongly object to making landfall forecasts this early. I think it is irresponsible to make landfall predictions this early on. Everyone is at equal risk.
Here is a statistical analysis of analog seasons vs all season (1870-2023). It was done with PSPP.
Analog
| Tropical Storm | Mean | 14.77 | |
| 95% Confidence Interval for Mean | Lower Bound | 10.03 | |
| Upper Bound | 19.51 | ||
| 5% Trimmed Mean | 14.52 | ||
| Median | 14 | ||
| Variance | 61.53 | ||
| Std. Deviation | 7.84 | ||
| Minimum | 4 | ||
| Maximum | 30 | ||
| Range | 26 | ||
| Interquartile Range | 10.5 | ||
| Skewness | 0.68 | ||
| Kurtosis | 0.1 | ||
| Hurricane | Mean | 7.92 | |
| 95% Confidence Interval for Mean | Lower Bound | 5.5 | |
| Upper Bound | 10.35 | ||
| 5% Trimmed Mean | 7.8 | ||
| Median | 7 | ||
| Variance | 16.08 | ||
| Std. Deviation | 4.01 | ||
| Minimum | 3 | ||
| Maximum | 15 | ||
| Range | 12 | ||
| Interquartile Range | 7.5 | ||
| Skewness | 0.3 | ||
| Kurtosis | -1.04 | ||
| Major Hurricane | Mean | 3.38 | |
| 95% Confidence Interval for Mean | Lower Bound | 2 | |
| Upper Bound | 4.77 | ||
| 5% Trimmed Mean | 3.37 | ||
| Median | 3 | ||
| Variance | 5.26 | ||
| Std. Deviation | 2.29 | ||
| Minimum | 0 | ||
| Maximum | 7 | ||
| Range | 7 | ||
| Interquartile Range | 4.5 | ||
| Skewness | 0.08 | ||
| Kurtosis | -1.38 | ||
| ACE | Mean | 130.69 | |
| 95% Confidence Interval for Mean | Lower Bound | 81.71 | |
| Upper Bound | 179.68 | ||
| 5% Trimmed Mean | 130.62 | ||
| Median | 141.3 | ||
| Variance | 6570.41 | ||
| Std. Deviation | 81.06 | ||
| Minimum | 17.4 | ||
| Maximum | 245.3 | ||
| Range | 227.9 | ||
| Interquartile Range | 153.3 | ||
| Skewness | -0.03 | ||
| Kurtosis | -1.54 | ||
| ACE/Storm | Mean | 8.78 | |
| 95% Confidence Interval for Mean | Lower Bound | 5.94 | |
| Upper Bound | 11.61 | ||
| 5% Trimmed Mean | 8.39 | ||
| Median | 8.76 | ||
| Variance | 21.98 | ||
| Std. Deviation | 4.69 | ||
| Minimum | 3.68 | ||
| Maximum | 20.87 | ||
| Range | 17.2 | ||
| Interquartile Range | 6.05 | ||
| Skewness | 1.42 | ||
| Kurtosis | 2.81 |
How do analog seasons compare as a whole. Statistics from 1870 to 2023.
| Tropical Storm | Mean | 10.41 | |
| 95% Confidence Interval for Mean | Lower Bound | 9.67 | |
| Upper Bound | 11.15 | ||
| 5% Trimmed Mean | 10.14 | ||
| Median | 10 | ||
| Variance | 21.76 | ||
| Std. Deviation | 4.66 | ||
| Minimum | 1 | ||
| Maximum | 30 | ||
| Range | 29 | ||
| Interquartile Range | 6 | ||
| Skewness | 1.05 | ||
| Kurtosis | 2.09 | ||
| Hurricane | Mean | 5.66 | |
| 95% Confidence Interval for Mean | Lower Bound | 5.24 | |
| Upper Bound | 6.09 | ||
| 5% Trimmed Mean | 5.55 | ||
| Median | 5 | ||
| Variance | 7.06 | ||
| Std. Deviation | 2.66 | ||
| Minimum | 0 | ||
| Maximum | 15 | ||
| Range | 15 | ||
| Interquartile Range | 3 | ||
| Skewness | 0.69 | ||
| Kurtosis | 0.54 | ||
| Major Hurricane | Mean | 2.08 | |
| 95% Confidence Interval for Mean | Lower Bound | 1.82 | |
| Upper Bound | 2.34 | ||
| 5% Trimmed Mean | 1.97 | ||
| Median | 2 | ||
| Variance | 2.71 | ||
| Std. Deviation | 1.65 | ||
| Minimum | 0 | ||
| Maximum | 7 | ||
| Range | 7 | ||
| Interquartile Range | 2 | ||
| Skewness | 0.86 | ||
| Kurtosis | 0.24 | ||
| ACE | Mean | 94.82 | |
| 95% Confidence Interval for Mean | Lower Bound | 86.25 | |
| Upper Bound | 103.39 | ||
| 5% Trimmed Mean | 91.46 | ||
| Median | 84.25 | ||
| Variance | 2897.5 | ||
| Std. Deviation | 53.83 | ||
| Minimum | 2.5 | ||
| Maximum | 258.6 | ||
| Range | 256.1 | ||
| Interquartile Range | 74.22 | ||
| Skewness | 0.88 | ||
| Kurtosis | 0.37 | ||
| ACE/Storm | Mean | 9.2 | |
| 95% Confidence Interval for Mean | Lower Bound | 8.58 | |
| Upper Bound | 9.82 | ||
| 5% Trimmed Mean | 9 | ||
| Median | 8.6 | ||
| Variance | 15.13 | ||
| Std. Deviation | 3.89 | ||
| Minimum | 1.83 | ||
| Maximum | 21.68 | ||
| Range | 19.86 | ||
| Interquartile Range | 5.58 | ||
| Skewness | 0.8 | ||
| Kurtosis | 0.56 |
The 95% Confidence Interval for analog season vs the whole season is wide. Analog seasons are more active. It is largely due to many of the analog years being very active. I can use the statistical analysis to come up with a forecast.
What is my prediction for this season?
20 to 30 named storms, likely 25 named storms
10 to 16 hurricanes, likely 13 hurricanes
3 to 7 major hurricanes with 5 major hurricanes
ACE is 180 to 250 with ACE likely of 190 to 230
Let’s see how my April 2023 hurricane forecast compare to the actual 2023 season.
10 to 15 named storms, likely 12 named storms
3 to 6 hurricanes, likely 5 hurricanes
1 to 3 major hurricanes with 2 major hurricanes
ACE is 70 to 140 with ACE likely of 80 to 100
Colorado State University
13/6/2 ACE: 100
Joe Bastardi (Weather Bell)
10-14 Storms/5-7 Hurricanes/2-3 Major Hurricanes ACE: 70-110
Tropical Storm Risk
12/6/2 ACE: 84
Accuweather
11-15 Storms/4-8 Hurricanes/1-3 Major Hurricanes ACE: 75-105
Crown Weather
12/6/2 ACE: 90
The Weather Channel
15/7/3
Weather Tiger
13-18 Tropical Storms/5-8 Hurricanes/2-3 Major Hurricanes ACE: 65-135
University of Arizona
19/9/5 ACE: 163
North Carolina University
11-15 Storms/6-8 Hurricanes/2-3 Major Hurricanes
2023 Actual Number
20 Named Storms
7 Hurricanes
3 Major Hurricanes
146 ACE
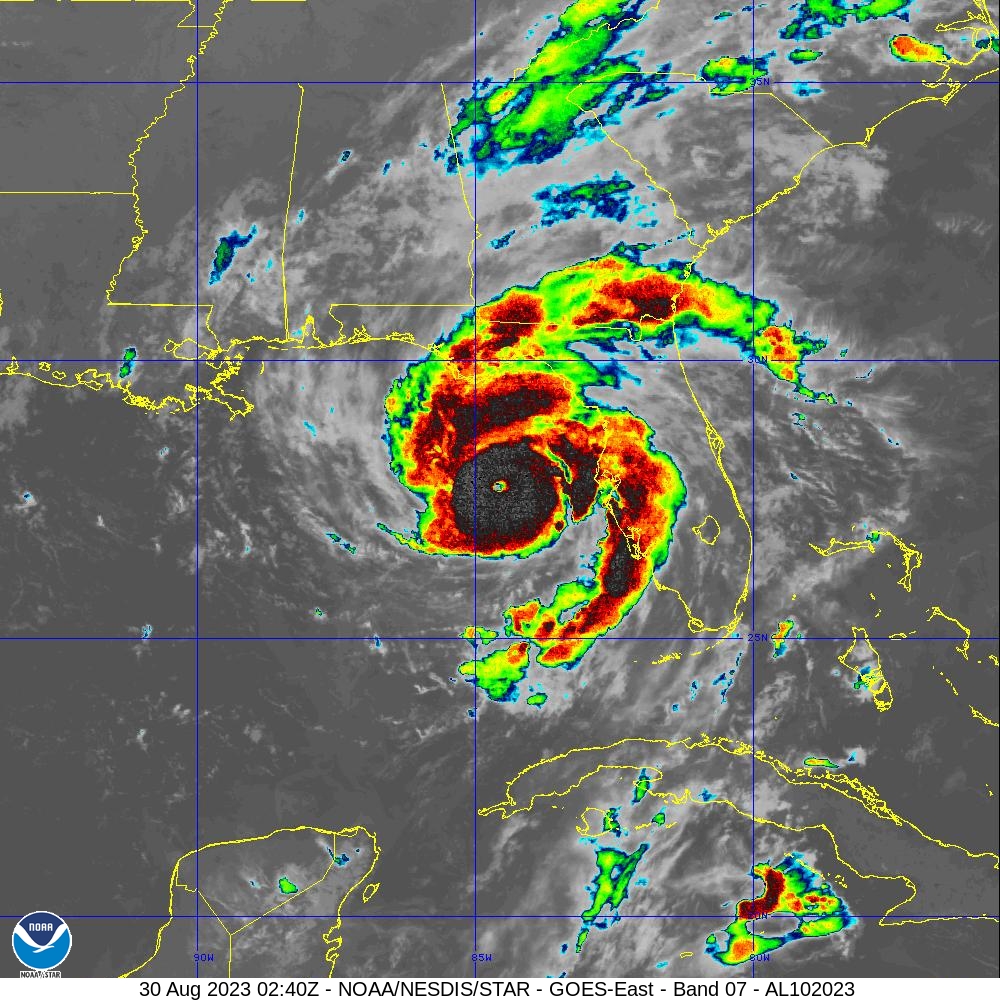
Many including myself got the forecast off. The 2023 Hurricane Season was more active than forecasted. Even with a strong El Nino, 2023 was quite an active season. It shows, El Nino is not the only factor. The Atlantic water was quite warm in 2023.
Regardless of forecast, I think 2024 could be an interesting hurricane season. It could be a harry one as I have said in the past. It only takes one to be a devastating season regardless of how inactive or active a season is. I would not be surprised if 2024 is an active season. I predict we could see 2 to 4 Category 5 hurricanes this season.