April 2024 Hurricane Season Forecast

2024 has proven to be a turbulent year. Israel, Sudan, and Ukraine are engulfed in war. The 2020s have been a turbulent decade so far. Hurricane Season is coming as it starts on June 1, 2024. Here are other forecasts. ACE is short for Accumulated Cyclone Energy.

Colorado State University
23/11/5 ACE: 210

Joe Bastardi (Weather Bell)
25-30 Tropical Storms/14-16 Hurricanes/6-8 Major Hurricanes ACE: 200-240

Tropical Storm Risk
20/9/4 ACE: 160

Accuweather
20-25 Tropical Storms/8-12 Hurricanes/4-7 Major Hurricanes ACE: 175-225

Crown Weather
25/12/6 ACE: 225

The Weather Channel
24/11/6

Weather Tiger
20-24 Tropical Storms/9-12 Hurricanes/4-7 Major Hurricanes ACE: 160-225

University of Arizona
21/11/5 ACE: 156

North Carolina University
15-20 Tropical Storms/10-12 Hurricanes/3-4 Major Hurricanes

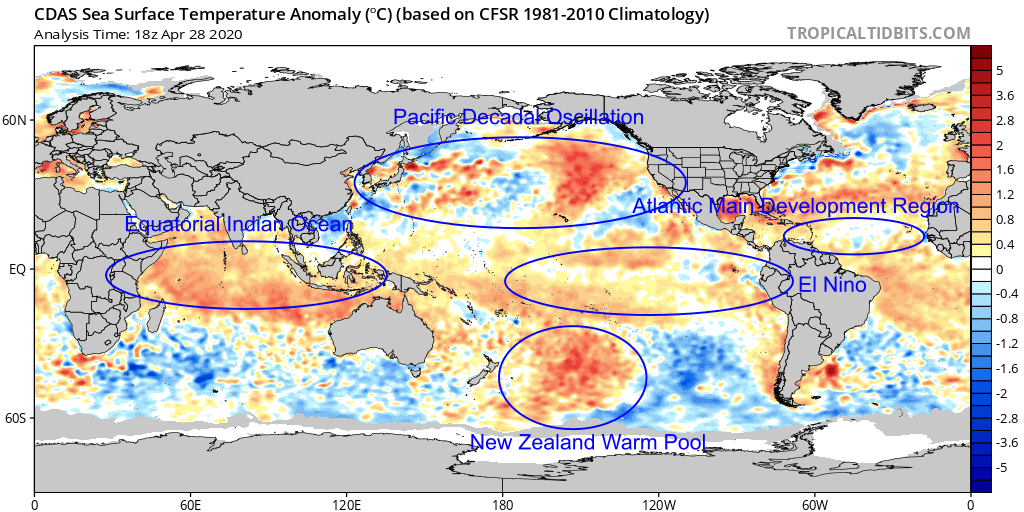
The analog years I am using are in which El Nino is fading away and going into La Nina. Obviously, the forecast is uncertain. In this case, I am more looking at Eastern Equatorial El Nino. I also take into account El Nino Modoki. The warmest water is in the Central to Western Pacific.

El Nino is not the only factor. I look at Atlantic Multidecadal Oscillation (AMO), Pacific Decadal Oscillation (PDO), Northeast Pacific Warm Pool (NEPWP), Equatorial Indian Ocean (EIO), Tropical South Atlantic (TSAI), New Zealand Warm Pool (NZWP), Quasi-Biennial Oscillation (QBO), Atlantic Main Development Region (MDR), Dipole Mode Index (DMI), and Tripole Index for the Interdecadal Pacific Oscillation (TPI IPO). Here is the ocean temperature anomaly map. It is from Tropical Tidbits.
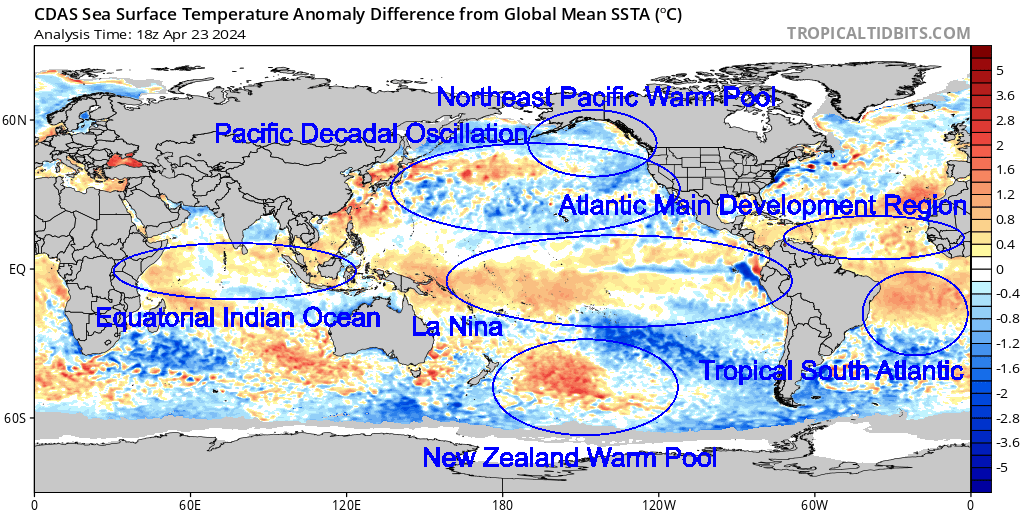
Based on this, the analog years are 1897, 1926, 1931, 1958, 1977, 1983, 1995, 1998, 2005, 2007, 2010, 2016, and 2020

Analog Years For 2024 (TS/H/MH ACE ACE/Storm)
1897 (6/3/0 55 9.1)
1926 (11/8/6 230 20.9)
1931 (13/3/1 48 3.7)
1958 (12/7/3 110 9.1)
1977 (6/5/1 25 4.2)
1983 (4/3/1 17 4.4)
1995 (19/11/5 227 12.0)
1998 (14/10/3 182 13.0)
2005 (28/15/7 245 8.8)
2007 (15/6/2 74 4.9)
2010 (19/12/5 166 8.7)
2016 (15/7/4 141 9.4)
2020 (30/13/6 180 6.0)

All of the seasons had major hurricane with the exception of 1897. However, this is before satellite era. It is likely before satellites, the seasons were more active than what is recorded. Any season before satellite should be considered suspect. Even in satellite era, some data is rather questionable. The most active are 2005 and 2020. In terms of Accumulated Cyclone Energy (ACE), that goes to 2005 with ACE of 245. 1926 and 1995 are not far behind.

Here are notable storms in the analog seasons.
1897
Hurricane #1
Hurricane #2
Hurricane #5

1926
1926 Nassau Hurricane
Great Miami Hurricane Of 1926
Great Havana-Bermuda Hurricane Of 1926

1931
Tropical Storm #5
1931 British Honduras Hurricane

1958
Alma
Ella
Helene

1977
Anita

1983
Alicia

1995
Dean
Erin
Luis
Marilyn
Opal
Roxanne

1998
Charley
Earl
Francis
Georges
Mitch

2005
Dennis
Emily
Katrina
Rita
Stan
Vince
Wilma
Alpha
Beta
Gamma
Delta

2007
Dean
Erin
Felix
Humberto
Noel

2010
Alex
Hermine
Igor
Karl
Matthew
Nicole

2016
Earl
Matthew
Nicole
Otto

2020
Hanna
Laura
Sally
Teddy
Alpha
Beta
Delta
Zeta
Eta
Iota

The analog season have some memorable and deadly storms. Hurricane Mitch in 1998 dumped heavy rain over a large area of Central America. It led to massive flooding that claimed at least 12,000 lives. Mitch is the deadliest since the Great Hurricane of 1780. 1926 has the Great Miami Hurricane of 1926. It would likely be the costliest if it happened today. 1931 had the British Honduras Hurricane, which claimed over 2,500 lives. 1958 had Alma and Ella impact Texas with heavy rain and flooding. 1977 had Anita, which was a powerful Category 5 hurricane in the Gulf Of Mexico. Alicia ravaged Southeast Texas inn 1983. 1977 and 1983 were less active seasons. 1995 was an active season with Luis, Marilyn, Opal, and Roxanne. Besides Mitch, there was Georges, which was a long lived and dangerous hurricane. Charley and Francis dumped heavy rain on Texas. 2005 was a brutal year. It can be summed up with Katrina, Rita, Stan, and Wilma. New Orleans was flooded from levee failure, while Mississippi was utterly gutted by monster storm surge. Rita caused a scare in Texas before making landfall on Sabine Pass. Stan dumped heavy rain and flooding in Guatemala and Mexico. Wilma rapidly intensified into the most intense Atlantic hurricane known. Dean and Felix ravaged the Caribbean. Noel proved to be a disaster for Dominican Republic and Haiti. Texas had to contend with Erin and Humberto. Humberto formed quickly right before landfall a year to the day before Ike made landfall in 2008. 2010 had many storms form. Alex was a large storm that dumped heavy rain over Mexico and Texas. Igor was a monster hurricane that tracked across the Atlantic. 2016 had Matthew ravaged Haiti, Florida, and North Carolina with strong winds, heavy rain, and flooding. 2020 was active during the COVID pandemic. Laura and Delta ravaged Southwest Louisiana within weeks of each other. Zeta went over New Orleans as a Category 1 hurricane. Eta and Iota were cruel to Nicaragua. They made landfall weeks apart of each other. I am not suggesting 2024 will see another Great Miami Hurricane of 1926, 1931 British Honduras Hurricane, Alicia, Opal, Mitch, Katrina, Wilma, Dean, Alex, Matthew, Laura, or Iota.

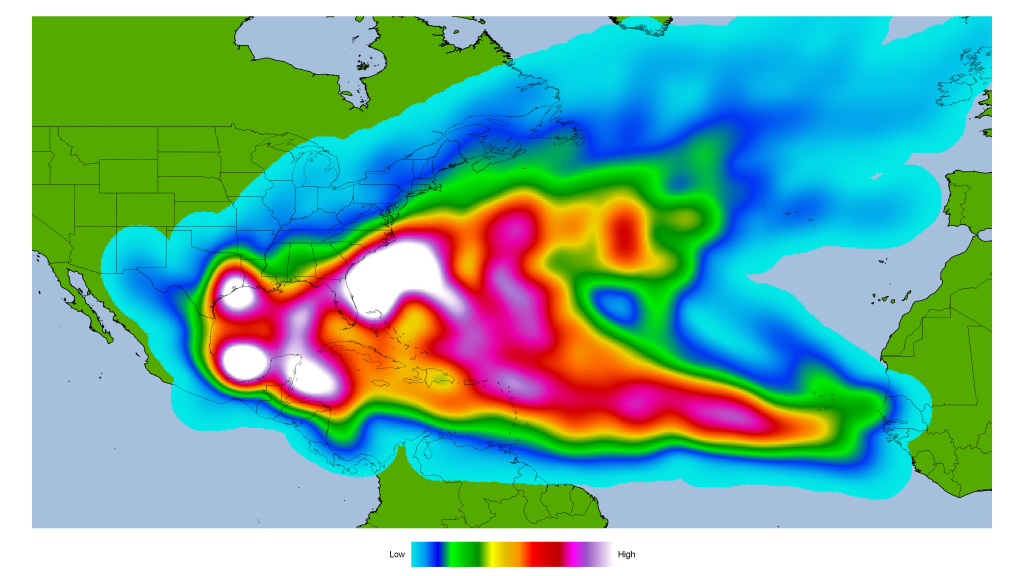
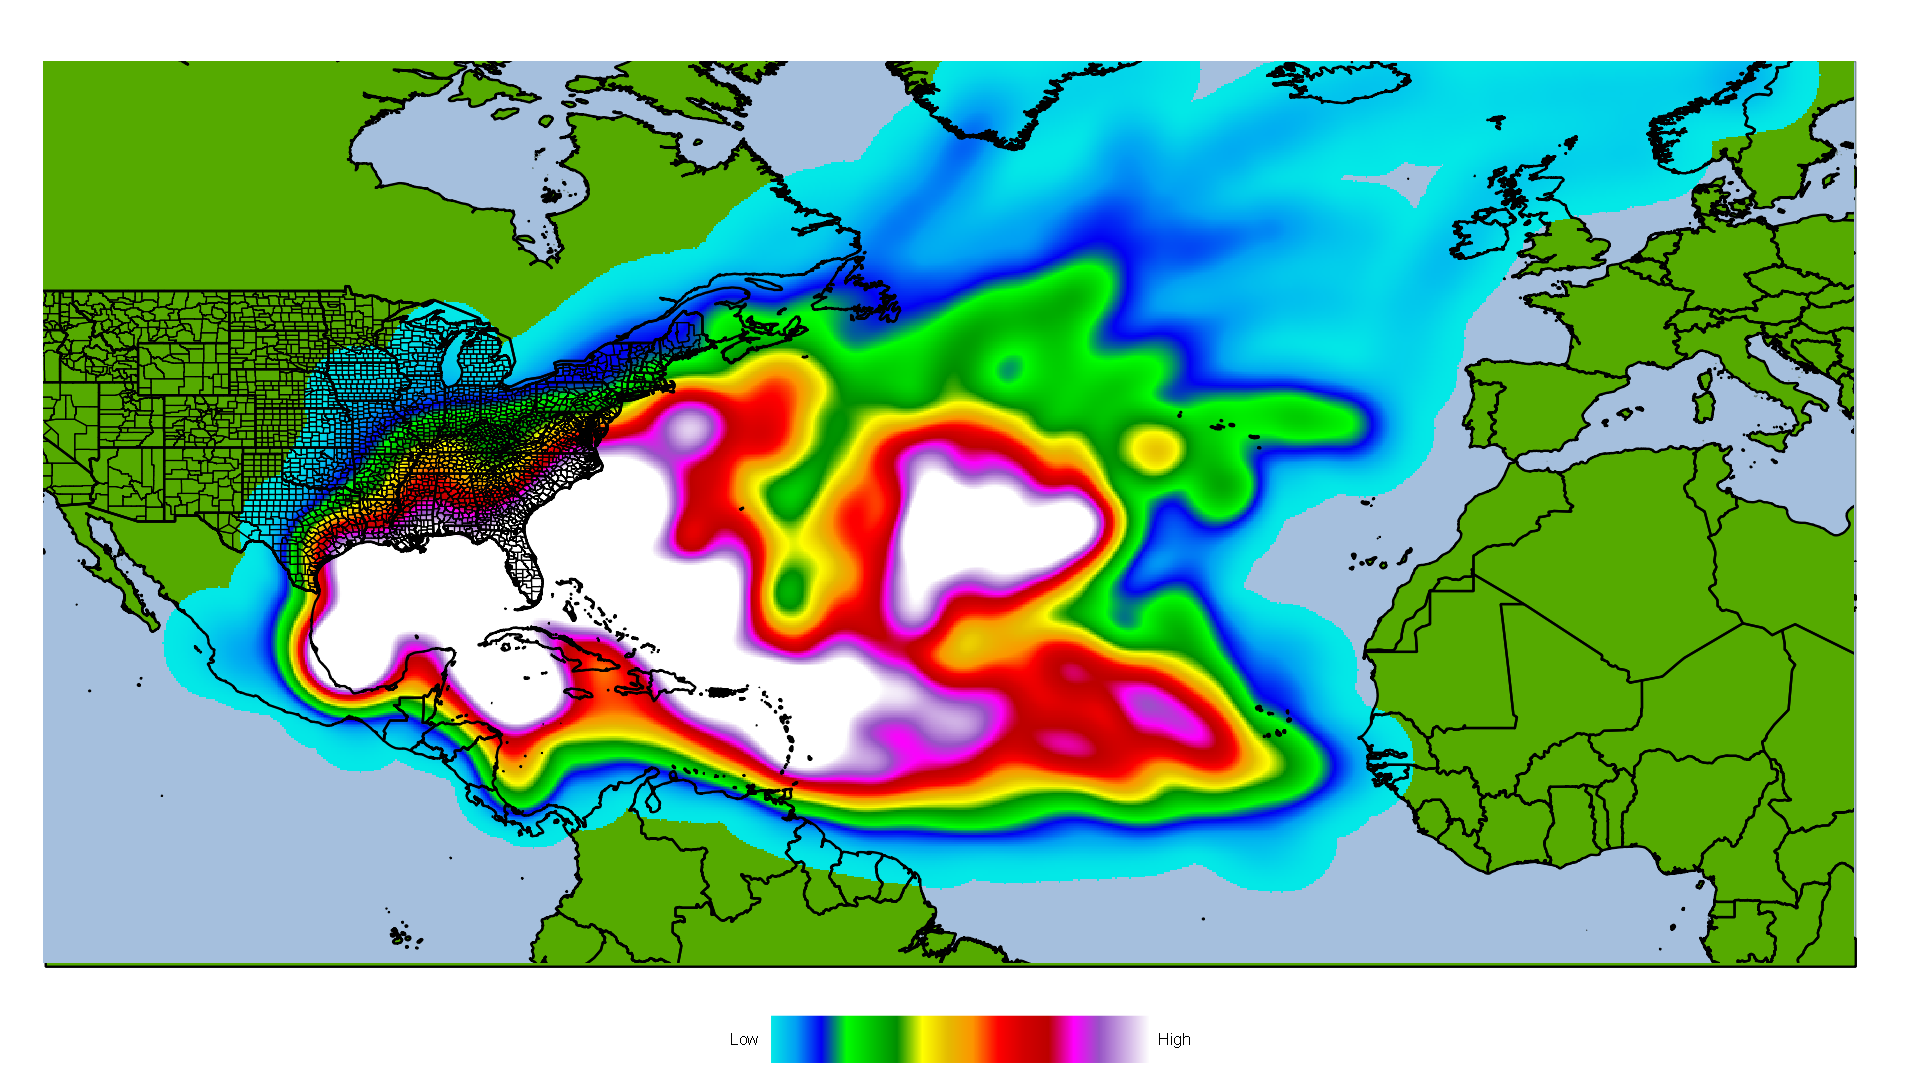
Here is a heat map of analog seasons. It is based on 300 mile radius from the storms. It was created with QGIS. The hurricane data came from International Best Track Archive for Climate Stewardship (IBTrACS).

The Caribbean, Gulf Of Mexico, and Carolina Coasts look to have the most development. I never make landfall predictions. I strongly object to making landfall forecasts this early. I think it is irresponsible to make landfall predictions this early on. Everyone is at equal risk.

Here is a statistical analysis of analog seasons vs all season (1870-2023). It was done with PSPP.

Analog

Tropical StormMean14.77
95% Confidence Interval for MeanLower Bound10.03
Upper Bound19.51
5% Trimmed Mean14.52
Median14
Variance61.53
Std. Deviation7.84
Minimum4
Maximum30
Range26
Interquartile Range10.5
Skewness0.68
Kurtosis0.1
HurricaneMean7.92
95% Confidence Interval for MeanLower Bound5.5
Upper Bound10.35
5% Trimmed Mean7.8
Median7
Variance16.08
Std. Deviation4.01
Minimum3
Maximum15
Range12
Interquartile Range7.5
Skewness0.3
Kurtosis-1.04
Major HurricaneMean3.38
95% Confidence Interval for MeanLower Bound2
Upper Bound4.77
5% Trimmed Mean3.37
Median3
Variance5.26
Std. Deviation2.29
Minimum0
Maximum7
Range7
Interquartile Range4.5
Skewness0.08
Kurtosis-1.38
ACEMean130.69
95% Confidence Interval for MeanLower Bound81.71
Upper Bound179.68
5% Trimmed Mean130.62
Median141.3
Variance6570.41
Std. Deviation81.06
Minimum17.4
Maximum245.3
Range227.9
Interquartile Range153.3
Skewness-0.03
Kurtosis-1.54
ACE/StormMean8.78
95% Confidence Interval for MeanLower Bound5.94
Upper Bound11.61
5% Trimmed Mean8.39
Median8.76
Variance21.98
Std. Deviation4.69
Minimum3.68
Maximum20.87
Range17.2
Interquartile Range6.05
Skewness1.42
Kurtosis2.81

How do analog seasons compare as a whole. Statistics from 1870 to 2023.

Tropical StormMean10.41
95% Confidence Interval for MeanLower Bound9.67
Upper Bound11.15
5% Trimmed Mean10.14
Median10
Variance21.76
Std. Deviation4.66
Minimum1
Maximum30
Range29
Interquartile Range6
Skewness1.05
Kurtosis2.09
HurricaneMean5.66
95% Confidence Interval for MeanLower Bound5.24
Upper Bound6.09
5% Trimmed Mean5.55
Median5
Variance7.06
Std. Deviation2.66
Minimum0
Maximum15
Range15
Interquartile Range3
Skewness0.69
Kurtosis0.54
Major HurricaneMean2.08
95% Confidence Interval for MeanLower Bound1.82
Upper Bound2.34
5% Trimmed Mean1.97
Median2
Variance2.71
Std. Deviation1.65
Minimum0
Maximum7
Range7
Interquartile Range2
Skewness0.86
Kurtosis0.24
ACEMean94.82
95% Confidence Interval for MeanLower Bound86.25
Upper Bound103.39
5% Trimmed Mean91.46
Median84.25
Variance2897.5
Std. Deviation53.83
Minimum2.5
Maximum258.6
Range256.1
Interquartile Range74.22
Skewness0.88
Kurtosis0.37
ACE/StormMean9.2
95% Confidence Interval for MeanLower Bound8.58
Upper Bound9.82
5% Trimmed Mean9
Median8.6
Variance15.13
Std. Deviation3.89
Minimum1.83
Maximum21.68
Range19.86
Interquartile Range5.58
Skewness0.8
Kurtosis0.56

The 95% Confidence Interval for analog season vs the whole season is wide. Analog seasons are more active. It is largely due to many of the analog years being very active. I can use the statistical analysis to come up with a forecast.

What is my prediction for this season?
20 to 30 named storms, likely 25 named storms
10 to 16 hurricanes, likely 13 hurricanes
3 to 7 major hurricanes with 5 major hurricanes
ACE is 180 to 250 with ACE likely of 190 to 230

Let’s see how my April 2023 hurricane forecast compare to the actual 2023 season.

10 to 15 named storms, likely 12 named storms
3 to 6 hurricanes, likely 5 hurricanes
1 to 3 major hurricanes with 2 major hurricanes
ACE is 70 to 140 with ACE likely of 80 to 100

Colorado State University
13/6/2 ACE: 100

Joe Bastardi (Weather Bell)
10-14 Storms/5-7 Hurricanes/2-3 Major Hurricanes ACE: 70-110

Tropical Storm Risk
12/6/2 ACE: 84

Accuweather
11-15 Storms/4-8 Hurricanes/1-3 Major Hurricanes ACE: 75-105

Crown Weather
12/6/2 ACE: 90

The Weather Channel
15/7/3

Weather Tiger
13-18 Tropical Storms/5-8 Hurricanes/2-3 Major Hurricanes ACE: 65-135

University of Arizona
19/9/5 ACE: 163

North Carolina University
11-15 Storms/6-8 Hurricanes/2-3 Major Hurricanes

2023 Actual Number
20 Named Storms
7 Hurricanes
3 Major Hurricanes
146 ACE

Many including myself got the forecast off. The 2023 Hurricane Season was more active than forecasted. Even with a strong El Nino, 2023 was quite an active season. It shows, El Nino is not the only factor. The Atlantic water was quite warm in 2023.

Regardless of forecast, I think 2024 could be an interesting hurricane season. It could be a harry one as I have said in the past. It only takes one to be a devastating season regardless of how inactive or active a season is. I would not be surprised if 2024 is an active season. I predict we could see 2 to 4 Category 5 hurricanes this season.

May 2021 Hurricane Season Forecast

We can all agree that 2020 was a crazy year no matter how one spins it ranging from COVID-19 pandemic to hurricane season. The coronavirus remains a major threat worldwide. Many nations are affected by the pandemic as it has sickened many. However, it has gotten better in America. Hurricane Season is coming as it starts on June 1, 2021. Here are other forecasts.

Colorado State University
17/8/4 ACE: 150

Joe Bastardi (Weather Bell)
16 to 22 Storms/9 to 13 Hurricanes/3 to 6 Major Hurricanes ACE: 150 to 200

Tropical Storm Risk
17/8/3 ACE: 134

Accuweather
16 to 20 Storms/7 to 10 Hurricanes/3 to 5 Major Hurricanes ACE: 120 to 160

Crown Weather
16/8/4

The Weather Channel
18/8/3

Weather Tiger
15/7/3

University of Arizona
18/8/4 ACE: 137

North Carolina University
15 to 18 Storms/7 to 9 Hurricanes/2 to 3 Major Hurricanes

The analog years I am using are in which we had a strong La Nina winter and the forecast is either Neutral to La Nina, while not ruling out El Nino. Obviously, the forecast is uncertain with El Nino or Neutral.

Based on this, the analog years are 1871, 1880, 1951, 1972, 1974, 1989, 1999, 2000, 2008, and 2011. I look at Atlantic Multidecadal Oscillation (AMO), Pacific Decadal Oscillation (PDO), Northeast Pacific Warm Pool (NEPWP), Equatorial Indian Ocean (EIO), Tropical South Atlantic (TSAI), New Zealand Warm Pool (NZWP), Quasi-Biennial Oscillation (QBO), and Atlantic Main Development Region (MDR). Here is the ocean temperature anomaly map. It is from Tropical Tidbits.

Analog Years For 2021 (TS/H/MH ACE ACE/Storm)
1871 (8/6/2 88 11.0)
1880 (11/9/2 131 11.9)
1951 (12/8/3 126 10.5)
1972 (7/3/0 36 5.1)
1974 (11/4/2 68 6.2)
1989 (11/7/2 135 12.3)
1999 (12/8/5 177 14.7)
2000 (15/8/3 119 7.9)
2008 (16/8/5 146 9.1)
2011 (19/7/4 126 6.6)

All of the seasons had major hurricane, except 1972. The most active is 2011 with 19 named storms, 7 hurricanes, and 4 major hurricanes. However, in terms of Accumulated Cyclone Energy (ACE), that goes to 1999. The least active is 1972 which only had 3 hurricanes and no major hurricanes. Any season before satellite should be considered suspect. Even in satellite, some data is rather questionable.

Here are notable storms in the analog seasons.

1871
Hurricane #3
Hurricane #4 or 1871 Santa Juana Hurricane

1880
Hurricane #2
Hurricane #4

1951
Charlie
How

1972
Agnes

1974
Carmen
Fifi

1989
Chantal
Hugo
Jerry

1999
Bret
Dennis
Floyd
Irene
Lenny

2000
Gordon
Keith
Leslie

2008
Dolly
Fay
Gustav
Hanna
Ike
Omar
Paloma

2011
Arlene
Irene

The analog season has some deadly and memorable storms. One of the deadliest hurricanes is Fifi, which claimed over 8,000 lives in Central America. Agnes flooded the Northeastern US. Fifi remains one of the deadliest Atlantic as of today. Charlie claimed over 250 lives in Jamaica. Hugo ravaged Leeward Islands, Windward Islands, Virgin Islands, Puerto Rico, and South Carolina. Floyd menaced East Coast, while Irene lingered over Florida. Lenny ravaged Virgin Islands, Windward Islands, Virgin Islands, and Lesser Antilles. Dolly, Fay, Hanna, Gustav, and Ike ravaged the US. Fay, Hanna, Gustav, and Ike ravaged Haiti. Irene went over the Eastern US. I am not suggesting 2021 will see something like Charlie, Agnes, Fifi, Hugo, Floyd, Keith, Gustav, Hanna, Ike, and Irene.

Here is a heat map of analog seasons. It is based on 300 mile radius from the storms. It was created with QGIS. The hurricane data came from International Best Track Archive for Climate Stewardship (IBTrACS).

The heat map have Upper Texas Coast, Southeastern US, Bahamas, and Mexico. However, when you look at the whole basin, everyone is at risk for landfall. I never make landfall predictions as I strongly object to doing landfall forecasts this early. Everyone is at equal risk.

Here is a statistical analysis of analog seasons vs all season. It was done with PSPP.

Analog

Tropical StormMean12.2
95% Confidence Interval Lower BoundLower Bound9.61
95% Confidence Interval Upper BoundUpper Bound14.79
Median11.5
Std. Deviation3.61
HurricaneMean6.8
95% Confidence Interval Lower BoundLower Bound5.42
95% Confidence Interval Upper BoundUpper Bound8.18
Median7.5
Std. Deviation1.93
Major HurricaneMean2.8
95% Confidence Interval Lower BoundLower Bound1.69
95% Confidence Interval Upper BoundUpper Bound3.91
Median2.5
Std. Deviation1.55
ACEMean115.23
95% Confidence Interval Lower BoundLower Bound86.15
95% Confidence Interval Upper BoundUpper Bound144.32
Median126.31
Std. Deviation40.65
ACE/StormMean9.55
95% Confidence Interval Lower BoundLower Bound7.34
95% Confidence Interval Upper BoundUpper Bound11.75
Median9.82
Std. Deviation3.08

How do analog seasons compare as a whole. Statistics from 1870 to 2020.

Tropical StormMean10.26
95% Confidence Interval Lower BoundLower Bound9.53
95% Confidence Interval Upper BoundUpper Bound10.99
Median10
Std. Deviation4.55
HurricaneMean5.64
95% Confidence Interval Lower BoundLower Bound5.2
95% Confidence Interval Lower BoundUpper Bound6.07
Median5
Std. Deviation2.69
Major HurricaneMean2.06
95% Confidence Interval Lower BoundLower Bound1.79
95% Confidence Interval Lower BoundUpper Bound2.33
Median2
Std. Deviation1.65
ACEMean94.28
95% Confidence Interval Lower BoundLower Bound85.51
95% Confidence Interval Lower BoundUpper Bound103.06
Median83.47
Std. Deviation54.57
ACE/StormMean9.24
95% Confidence Interval Lower BoundLower Bound8.61
95% Confidence Interval Upper BoundUpper Bound9.88
Median8.62
Std. Deviation3.95

The 95% Confidence Interval for analog season vs the whole season is wide. Analog seasons could either be inactive or active. Analog seasons are above average compared to the whole season.

What is my prediction for this season?
14 to 22 named storms, likely 17 named storms
6 to 12 hurricanes, likely 9 hurricanes
2 to 6 major hurricanes with 4 major hurricanes
ACE is 120 to 190 with ACE likely of 130 to 180

Let’s see how my April 2020 hurricane forecast compare to the actual 2020 season.

12 to 20 named storms, likely 16 named storms
6 to 12 hurricanes, likely 9 hurricanes
2 to 6 major hurricanes with 4 major hurricanes
ACE is 120 to 220 with ACE likely of 140 to 200

Colorado State University
16/8/4 ACE: 150

Joe Bastardi (Weather Bell)
14 to 20 Storms/7 to 11 Hurricanes/3 to 6 Major Hurricanes ACE: 145 to 195

Tropical Storm Risk
16/8/3 ACE: 130

Accuweather
14 to 18 Storms/7 to 9 Hurricanes/2 to 4 Major Hurricanes

Crown Weather
15/8/3

The Weather Channel
18/9/4

Weather Tiger
16/8/4

University of Arizona
19/10/5 ACE: 163

North Carolina University
18 to 22 Storms/8 to 11 Hurricanes/3 to 5 Major Hurricanes

2020 Actual Number
30 Named Storms
14 Hurricanes
6 Major Hurricanes
180 ACE

Many including myself got the forecast off. The 2020 Hurricane Season was more active than forecasted. The ACE was under compared to the actual ACE. I did get the ACE right. There is always room for improvement.

Regardless of forecast, I think 2021 could be an interesting hurricane season. It could be a harry one with the COVID-19 pandemic going on. Viruses are unpredictable like weather. If you want to read more about the COVID-19 pandemic, you can check out my other blog, The Ebola Zone.

Deja Vu In Central America

Courtesy of Marshall Space Flight Center Earth Science Office https://weather.msfc.nasa.gov/.

A sense of deja vu in this crazy and tragic year of 2020. Nicaragua got hit by two monster hurricanes 12 days apart in the same area by Eta and Iota. It is eerily similar to Laura and Delta did to Louisiana. It comes at a time when the world is ravaged by COVID-19 pandemic. There are over 56 million confirmed COVID-19 cases worldwide as of November 18, 2020 per Worldometer. If you want to read about COVID-19 pandemic, head over to my other blog, The Ebola Zone.

Iota is 2020’s strongest hurricane as a Category 5 hurricane. It is likely other hurricanes prior to Iota were Category 5 in 2020 like Eta. Iota is the second known Category 5 hurricane to occur in November. The other being the 1932 Cuba Hurricane. It is possible that Hurricane Lenny in 1999 was Category 5 in November. It is likely Category 5 hurricanes have occurred in November.

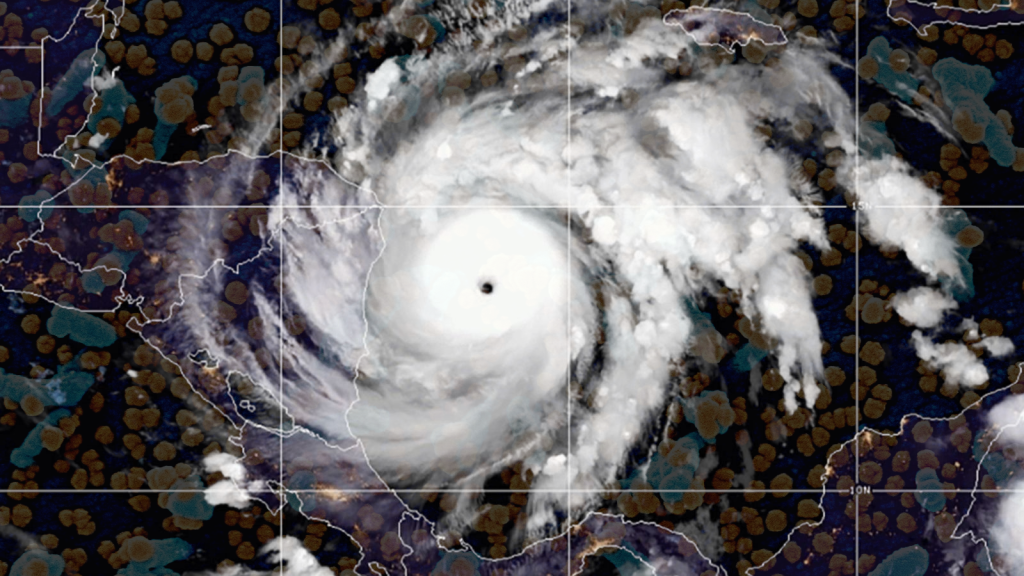
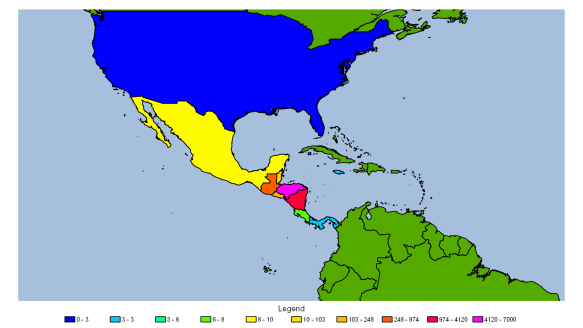
Eta and Iota have hit Central America. Central America has some of the deadliest Atlantic hurricanes in history. Mitch comes to mind, which claimed over 11,000 lives. Here is a thematic map of Mitch’s death toll. The GIS map is created from QGIS.

Most of Mitch’s death toll occurred in Honduras and Nicaragua. Mitch is the second deadliest Atlantic hurricane after the Great Hurricane of 1780. The death and destruction are from heavy rain and massive flooding. Some areas in Central America likely saw over 100 inches of rain. This would of been in mountainous areas, where rain is heavier.

What is the current death toll from Eta and Iota? Here is a death toll map as of November 18, 2020.

The death toll from Eta and Iota is 220. If missing are including, the death toll rises to 372. I would not be surprised if the death toll is going to be much higher. I am not going to speculate how high it could be. It is made much worse with COVID-19 ravaging the world.

I will keeping an eye on the Atlantic basin and COVID-19 pandemic.

April 2020 Hurricane Season Forecast

The world is dealing with the COVID-19 pandemic. Many nations are affected by the pandemic as it has sickened many. Hurricane season is not on anyone’s mind as many are staying home and social distancing to curb the spread of the coronavirus. Hurricane Season is coming as it starts on June 1, 2020. Here are other forecasts.

Colorado State University
16/8/4 ACE: 150

Joe Bastardi (Weather Bell)
14 to 20 Storms/7 to 11 Hurricanes/3 to 6 Major Hurricanes ACE: 145 to 195

Tropical Storm Risk
16/8/3 ACE: 130

Accuweather
14 to 18 Storms/7 to 9 Hurricanes/2 to 4 Major Hurricanes

Crown Weather
15/8/3

The Weather Channel
18/9/4

Weather Tiger
16/8/4

University of Arizona
19/10/5 ACE: 163

North Carolina University
18 to 22 Storms/8 to 11 Hurricanes/3 to 5 Major Hurricanes

They are all predicting an active season.

The analog years I am using are in which El Nino started late and is forecasted to be El Nino for the rest of the year to next year. Obviously, the forecast is uncertain with El Nino or Neutral.

Based on this, the analog years are 1881, 1901, 1937, 1944, 1949, 1979, 1990, 2004, 2013, and 2017. The winter started as Neutral and is forecasted to either go Neutral, La Nina, or El Nino. El Nino is not the only factor. I look at Atlantic Multidecadal Oscillation (AMO), Pacific Decadal Oscillation (PDO), Northeast Pacific Warm Pool (NEPWP), Equatorial Indian Ocean (EIO), Tropical South Atlantic (TSAI), New Zealand Warm Pool (NZWP), Quasi-Biennial Oscillation (QBO), and Atlantic Main Development Region (MDR). Here is the ocean temperature anomaly map. It is from Tropical Tidbits.

Analog Years For 2020 (TS/H/MH ACE ACE/Storm)
1881 7/4/0 59 8.4
1901 13/6/0 99 7.6
1937 11/4/1 66 6.0
1944 14/8/3 104 7.4
1949 16/7/2 96 6.0
1979 9/5/2 93 10.3
1990 14/8/1 97 6.9
2004 15/9/6 227 15.1
2013 14/2/0 36 2.6
2017 17/10/6 225 13.2

All of the seasons had major hurricane, except 1881, 1901, and 2013. However, I consider 1881 and 1901 suspect because of no satellite. That includes any season before satellite. The most active is 2017 with 17 named storms, 10 hurricanes, and 6 major hurricanes. The least active is 2013 which only had 2 hurricanes and no major hurricanes.

Here are notable storms in the analog seasons.

1881
Hurricane #5 or Georgia Hurricane of 1881

1901
Tropical Storm #2
Hurricane #4 or 1901 Louisiana Hurricane

1937
Tropical Storm #3

1944
Hurricane #7 or 1944 Great Atlantic Hurricane
Hurricane #13 or 1944 Cuba–Florida hurricane

1949
Hurricane #2 or Florida Hurricane of 1949
Hurricane #11 or Texas Hurricane of 1949

1979
Tropical Storm Claudette
Hurricane David
Hurricane Frederic

1990
Hurricane Diana
Hurricane Klaus

2004
Hurricane Charley
Hurricane Frances
Hurricane Ivan
Hurricane Jeanne

2013
Hurricane Ingrid

2017
Hurricane Harvey
Hurricane Irma
Hurricane Maria

Many of these notable storms in analog seasons were prodigious rainmakers like Claudette and Harvey. Claudette dumped 43 inches of rain in 24 hours near Alvin. It was the highest 24 hour total in American and broken in Waipā Garden, Hawaii on April 14-15, 2018. The rain event dumped nearly 50 inches of rain in 24 hours! Harvey dumped heavy rain over a large area and led to massive flooding. Many areas saw 30 to 40 inches of rain with totals as high as 70 inches! Some were intense like David, Ivan, Irma, and Maria, which were Category 5 hurricanes. Jeanne and Maria are some of the deadliest Atlantic hurricanes, which claimed over 3,000 lives. I am not suggesting 2020 will see something like Claudette, David, Ivan, Jeanne, Harvey, Irma, and Maria.

Here is a heat map of analog seasons. It is based on 300 mile radius from the storms. It was created with QGIS. The hurricane data came from International Best Track Archive for Climate Stewardship (IBTrACS).
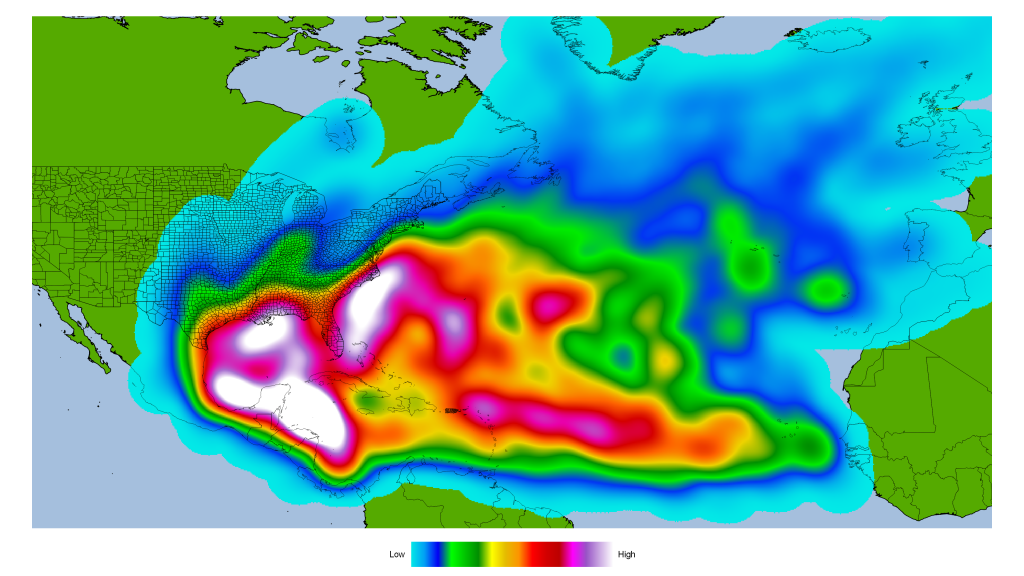
The heat map has Gulf of Mexico, Southeastern US, and Caribbean. However, when you look at the whole basin, everyone is at risk for landfall. I never make landfall predictions as I strongly object to doing landfall forecasts this early. Everyone is at equal risk.

Here is a statistical analysis of analog seasons vs all season. It was done with PSPP..

Analog
Mean
13/6.3/2.1
13/6/2 (Rounded Up)

Median
14/6.5/1.5
14/7/2 (Rounded Up)

Standard Deviation
3.13/2.54/2.28

ACE
Mean
110.2

Median
96.5

Standard Deviation
64.75

ACE/Storm
Mean
8.37

Median
7.52

Standard Deviation
3.68

95% Confidence Interval
Tropical Storm
Lower Bound: 10.76
Upper Bound: 15.24

Hurricane
Lower Bound: 4.48
Upper Bound: 8.12

Major Hurricane
Lower Bound: 0.47
Upper Bound: 3.73

ACE
Lower Bound: 63.88
Upper Bound: 156.52

ACE/Storm
Lower Bound: 5.74
Upper Bound: 11

How do analog seasons compare as a whole. Statistics from 1870 to 2019.

Mean
9.99/5.55/2.07
10/6/2

Median
10/5/2

Standard Deviation
4.24/2.63/1.68

ACE
Mean
93.59

Median
84

Standard Deviation
54.45

ACE/Storm
Mean
9.39

Median
8.67

Standard Deviation
4.01

95% Confidence Interval
Tropical Storm
Lower Bound: 9.3
Upper Bound: 10.68

Hurricane
Lower Bound: 5.13
Upper Bound: 5.98

Major Hurricane
Lower Bound: 1.8
Upper Bound: 2.34

ACE
Lower Bound: 84.8
Upper Bound: 102.37

ACE/Storm
Lower Bound: 8.74
Upper Bound: 10.04

The 95% Confidence Interval for analog season vs the whole season is wide. Analog seasons could either be inactive or active. Analog seasons are above average compared to the whole season.

What is my prediction for this season?
12 to 20 named storms, likely 16 named storms
6 to 12 hurricanes, likely 9 hurricanes
2 to 6 major hurricanes with 4 major hurricanes
ACE is 120 to 220 with ACE likely of 140 to 200

Let’s see how my April 2019 hurricane forecast compare to the actual 2019 season.

9 to 15 named storms, likely 12 named storms
5 to 10 hurricanes, likely 7 hurricanes
1 to 4 major hurricanes with 2 major hurricanes
ACE is 60 to 120 with ACE likely of 70 to 110

Colorado State University
13/5/2 ACE: 80

Joe Bastardi (Weather Bell)
10 to 15 Storms/4 to 7 Hurricanes/0 to 2 Major Hurricanes ACE: 60 to 110

Tropical Storm Risk
12/5/2 ACE: 81

Accuweather
10/5/3

Crown Weather
10/6/3

The Weather Channel
12/6/2

2019 Actual Number
18 Named Storms
6 Hurricanes
3 Major Hurricanes
131 ACE

Many including myself got the forecast off. The 2019 Hurricane Season was more active than forecasted. Most got the number of hurricanes and major hurricanes correct. The ACE was under, compared to the actual ACE. There is always room for improvement.

Regardless of forecast, I think 2020 could be an interesting hurricane season. It could be jarring with the COVID-19 pandemic going on with social distancing likely in place even with shelter in place being slowly phased out. It could flare up in the summer. I do not know as viruses are unpredictable like weather. If you want to read more about the COVID-19 pandemic, you can check out my other blog, The Ebola Zone.

Deja Vu

It is deja vu. Just two years earlier, Harvey ravaged Texas with heavy rain. Today, it is Imelda. Heavy rain fell east of the Houston area, mainly in Liberty, Chambers, and Beaumont area. It was again heavy rain at night. Some areas got 6 inches of rain in one hour! That is really intense on the same level as Harvey. The rains kept falling and falling well into the night and early morning. Here is a rainfall map I got from Advanced Hydrologic Prediction Service (AHPS) and used QGIS. The rainfall is from 12Z to 12Z, which from yesterday to today. 12Z is 7:00 AM CDT.

The 24 hour total is over 30 inches of rain. Not surprised as the rains were very intense, especially around Winnie in Chambers County.

Here is a two day total since 7:00 AM since September 17, 2019.

A large area got at least 20 inches of rain from coastal Texas to east of Houston. The highest total is nearly 36 inches. However, over 43 inches of rain fell near Fannett in the past three days.

If that is true, Imelda is one of the wettest tropical system in America. Here is the list of wettest tropical systems in America from list of wettest tropical cyclones in America.

1.) Harvey 2017 60.58
2.) Lane 2018 58.00
3.) Hiki 1950 52.00
4.) Amelia 1978 48.00
5.) Easy 1950 45.20
6.) Claudette 1979 45.00
7.) Imelda 2019 43.15
8.) TD 15 1970 41.68
9.) Allison 2001 40.68
10.) September 1921 Hurricane 39.71

Six of the ten are in Texas. Two are in Hawaii, and one are in Florida and Puerto Rico. Hawaii and Puerto Rico have mountainous terrain, which is more favorable for heavy rain. Some areas in Texas are hilly like in Central Texas with the case of Amelia. It is likely that over 50 inches of rain fell during Amelia based on this below.

Roland Manatt, in the Rocky Creek drainage along the divide between the Medina and Guadalupe Rivers, 8 mi northwest of Medina, measured 48 in. of rain in 52 hrs. He began measuring in a vegetable can which rapidly became tiresome in the sometimes over 4 in/hr intensities. He switched to a large fruit juice can and stayed awake over 2 days and nights measuring the rain. He said he dozed off a few times and let the can overflow – so the 48 in. is to be considered a lower limit.

Same goes with the 1921 flood as there were less weather stations and people back then to measure rain. This would also apply with the 1899 Brazos Flood as heavy rain fell over a large area in Texas. The 1899 flood was caused by Tropical Storm #1, which was a “weak” one like Imelda.

Here is a rainfall report from NWS Lake Charles.

000
SXUS54 KFWR 191531
HYDLCH

Rainfall Reports for the Lake Charles Hydrologic Service Area
National Weather Service...West Gulf RFC...Fort Worth, TX
1029 AM CDT Thu Sep 19 2019

Precipitation for the 24 hours ending about 7 a.m. Thursday September 19, 2019

Golden Triangle-Beaumont/Port Arthur/Orange...

Beaumont - Neches River 19.80 Beaumont-SE Texas Rgnl Arpt 13.70
Nederland 1.8 W 11.00 Vidor 7.2 N 10.00
Bridge City 1.3 NW 7.07 Port Arthur 3 NNE 5.03
Orange 3 SW - County Airport 4.81

Remainder of Lake Charles HSA...

Beaumont 10 W 19.43 Lumberton 2 NNE 10.34
Kirbyville 15 SSE - RAWS Site 7.56 Evadale 1 W - Neches River 6.13
Fred 6.05 McFadden 5.71
Kountze 5.24 Kountze 1.1 S 5.15
Jasper 3 SW 4.69 Kountze 4 NE - Village Creek 4.65
Spurger 6.2 S 4.45 Spurger 1 NE 4.15
Woodville 2 W 4.00 Town Bluff 2 NE-B A Steinhagen 3.93
Woodville 7.2 S 3.92 Warren 7 SE -Southern Rough 3.92
Lake Charles 4.8 SSE 3.90 Woodville - Harmony Station 3.75
Woodville 7 ENE 3.67 Woodville 2 SE 3.67
Chester 1 SE 3.60 Jasper 15 NNW - Sam Rayburn Rv 3.43
Colmesneil 7 ESE 3.23 Iowa 9.7 NNW 3.05
Bon Wier - Sabine River 2.74 Ragley 5 SE 2.72
Hackberry 8 SSW 2.56 Sulphur 2.2 E 2.53
Bell City 13 SW 2.20 Moss Bluff 2.15
Lake Charles 7 NW-SH Jones SP 2.10 De Ridder-Beauregard Par Arpt 2.05
Lake Charles - Regnl Airport 2.05 Lake Charles - Calcasieu River 2.05
Lake Charles 2 N 1.95 Lake Charles 11.5 SSW 1.91
Grand Chenier 10 NE 1.70 Dry Creek 8 NW 1.65
Grand Chenier 9 ESE 1.52 Jennings 1.12
Jennings 1 NW - Airport 1.10 Leesville 6 SSW 0.93
Bunkie 0.90 Abbeville 16 SSW 0.85
Kaplan 1.6 SSE 0.84 Abbeville 9.9 SW 0.83
Jasper 3 SSW 0.77 Marksville 1 W - FSA 0.75
Jeanerette 5 NW 0.68 Crowley 2 NE 0.66
Rayne 1 W 0.63 Carencro 0.55
Carencro 3.9 ENE 0.55 Leesville 0.50
Lafayette - Airport 0.46 Oberlin 0.40
Abbeville 1 E 0.25 Bunkie 0.3 WSW 0.24
Alexandria - England AFB 0.22 Grand Coteau 2.7 E 0.22
Ruby 3 W - Red River L & Dam 2 0.20 Alexandria - Regional Airport 0.16
Opelousas 1 ESE - FSA 0.16 Alexandria - Power Plant 0.08
St. Martinville 0.2 S 0.07 Opelousas 2 NW - Ahart Field 0.07
Morgan City 2 ESE 0.03

$$

Here is a rainfall report from NWS Houston.

034
SXUS54 KFWR 191531
HYDHGX

Rainfall Reports for the Houston / Galveston Hydrologic Service Area
National Weather Service...West Gulf RFC...Fort Worth, TX
1029 AM CDT Thu Sep 19 2019

Precipitation for the 24 hours ending about 7 a.m. Thursday September 19, 2019

Metro Houston...

Roman Forest 1.9 ENE 16.88 Conroe 0.7 E 12.25
Conroe - Montgomery Co Airport 11.05 Cleveland 3.6 S 10.93
Conroe 2.1 SSW 9.20 Conroe 1.1 W 5.00
Spring 5.7 N 4.36 Cloverleaf 1.7 W 3.86
Conroe 4 S - W Fk San Jacinto 2.86 Spring 4 N 2.80
Conroe 2.38 Pasadena 4.4 WNW 2.35
Spring 1.3 NW 2.33 Houston - Ship Channel Bridge 2.16
Sheldon - Lake Houston 2.08 Spring 3 NW - Panther Branch 2.08
The Woodlands - Panther Branch 2.02 Montgomery 2.00
Houston 2.1 NNE 1.80 Montgomery 2.6 NE 1.79
Houston - Hobby Airport 1.61 The Woodlands 2.8 N 1.56
Houston Westbury 1.44 Houston 5.9 SW 1.44
Houston - Bush Intl Airport 1.39 Houston 1.4 NE 1.39
The Woodlands 3.7 NNW 1.36 South Houston 3 S 1.32
Dickinson 0.5 NNE 1.31 Houston 2.1 SSW 1.27
The Woodlands 4.6 NNW 1.25 Tomball 2.7 ENE 1.23
Webster 3.9 NNW 1.22 Houston - Buffalo Bayou 1.22
Bunker Hill Village 3.6 NNW 1.21 Webster 2.8 NNW 1.20
West University Place 0.4 WNW 1.18 Hilshire Village 2.7 ENE 1.16
Spring Valley 2.7 NW 1.15 Montgomery 4 N 1.15
Pinehurst 3.8 SE 1.15 Katy 4.5 S 1.14
League City 0.9 WNW 1.02 Houston - Cole Ck at Diehl Rd 1.00
Pearland-Coward`s Ck@Cloverdal 1.00 Dickinson 1.4 W 0.97
Houston - Hooks Memorial Arpt 0.95 Friendswood 2.6 NE 0.95
League City 3.6 ENE 0.94 Pearland - Regional Airport 0.91
Houston - Keegans Bayou 0.91 Bunker Hill Village 4.4 WSW 0.90
Friendswood 2.5 NNE 0.90 Houston 4.7 WNW 0.88
Nassau Bay 0.9 ENE 0.81 Mission Bend 0.8 N 0.80
Hedwig Village 1.1 NNW 0.80 Kemah 0.2 WNW 0.79
Alvin 1.6 SW 0.77 The Woodlands 5.8 NW 0.75
Katy 3 SSE - Buffalo Bayou 0.73 League City 2.7 NE 0.69
The Woodlands 5.5 NW 0.66 Tomball 4.6 SSW 0.63
Missouri City 5.1 SSE 0.58 Sugar Land 1 W 0.52
Fulshear - Buffalo Bayou 0.51 Pearland 7.4 W 0.50
Arcola - HOU Southwest Airport 0.47 Magnolia 2.8 S 0.46
Katy 7.3 SSE 0.43 Sugar Land 3 SSE 0.42
Sugar Land Mncpl Airport 0.40 Manvel 3.6 S 0.40
Dobbin 1 NE - Lake Creek 0.37 Addicks - Langham Creek 0.31
Jersey Village 6.4 W 0.30 Missouri City 1.7 SSW 0.26
Richmond 4.4 NNE 0.22 Richmond 4.6 SE 0.18
Houston - IH 10 @ SH 6 0.12 Richmond 4.9 NNE 0.10
Richmond 2.9 NE 0.09 Richmond - Brazos River 0.06
Richmond 2.3 SE 0.05 Richmond 4.6 N 0.04
Barker - Barker Reservoir 0.01

Bryan/College Station Area...

College Station 6.4 ENE 0.41 Bryan 3.5 NNW 0.27
College Station 3 SE - Bee Ck 0.26 College Station 2 SSE 0.20
College Station 10.4 ENE 0.18 College Station 3 SE - Bee Ck 0.17
College Station 4.5 SW 0.12 Bryan 3.9 SSW 0.12
Bryan 3 NE- Coulter Field 0.10 Bryan 3.8 SSW 0.10
Shiro -Gibbons Creek Reservoir 0.09 College Station-Easterwood Apt 0.09
Madisonville 0.04 Gause 2.5 W 0.03
Bryan 7.1 N 0.02 Milano 5.2 ENE 0.02
Brenham 8 E 0.02 Brenham 0.7 E 0.02
Lyons - Davidson Creek 0.01 Normangee 9 SW - Navasota Rvr 0.01
Chappell Hill 1 NW 0.01

Galveston and Coastal Areas...

Galveston 6.4 NE 4.55 Freeport - Old Brazos River 4.53
Galveston 5.6 NE 3.78 Galveston - Scholes Airport 3.56
High Island 8 NNW - Anahuac 3.55 Galveston 8.3 NE 2.88
Texas City 3.8 E 1.23 La Marque 3.9 SE 1.15
Lake Jackson 1.6 E 0.92 Santa Fe 0.7 S 0.76
Alvin 6 SW - Chocolate Bayou 0.76 Sargent 1 ENE 0.73
West Columbia 1 ESE 0.65 Hitchcock 1.6 NNW 0.62
Angleton - Brazoria Co Arpt 0.52 Brazoria NWR 0.50
El Campo 4.9 SSE 0.35 Damon 1 NNW 0.28
Bay City - Colorado River 0.21 Edna 3.8 NNW 0.20
Ganado 1.5 W 0.16 Palacios 11.5 NNE 0.01

Remainder of Houston / Galveston HSA...

Dayton 1.1 SE 11.00 Dayton 0.2 E 9.02
Romayor - Trinity River 4.76 Cleveland 2 S 2.12
Livingston 2 W-Long King Creek 2.12 Livingston 0.5 E 2.08
El Campo 2.7 NW 1.77 El Campo 2 NW 1.66
El Campo 1 NW 1.24 Wharton 1.4 ESE 1.13
Wharton 0.3 E 1.09 Glen Flora - Colorado River 1.04
Wharton 3.1 NE 0.99 Oakhurst 3.6 SSE 0.90
Wharton - Colorado River 0.89 Lane City - Colorado River 0.80
Dodge 1.6 S 0.69 Ratcliff 0.65
Kennard 7 N 0.43 Livingston 13.4 NW 0.43
Livingston 8.4 W 0.37 Crockett 1.8 NNE 0.34
Point Blank 0.7 ESE 0.32 Crockett 10.5 SE 0.24
Onalaska 0.6 WSW 0.22 Trinity 2.9 E 0.22
Willis 5 NW - Huntsville RAWS 0.21 Trinity 3.7 E 0.20
Crockett 0.19 Huntsville 4.8 NNW 0.19
Huntsville - Municipal Airport 0.19 Huntsville 1.3 SSE 0.16
Trinity 5.1 NW 0.11 Yoakum - Ag Exp Station 0.11
Huntsville 11.5 WSW 0.09 Riverside - Trinity River 0.08
Sealy 0.3 WNW 0.07 East Bernard - San Bernard Rvr 0.05
Brenham 0.04 Bellville 0.9 ENE 0.02
Brenham 1.3 ESE 0.02 Attwater NWR near Lafitte 0.01
Sealy 10 SW - San Bernard Rvr 0.01 Hempstead - Brazos River 0.01
San Felipe 1 WNW 0.01 Bellville 6.5 NNE Trace

$$

Since there is a sense of deja vu with Harvey, here is a rainfall map of Harvey. It is from AHPS. It is from 7:00 AM August 25, 2017 to 7:00 AM September 1, 2017.

A large area got 30 to 40 inches of rain. The highest is nearly 55 inches in the map. The highest rainfall is 65 to 70 inches of rain from National Hurricane Center.

It is unfortunate many who were flooded by Harvey are now flooded by Imelda. The sense of deja vu for many. I hope for better days ahead.

April 2019 Hurricane Season Forecast

Many areas are still reeling from Harvey, Irma, Maria, and as of late Michael. Michael was updated to a Category 5 at landfall. Not surprised by it. Many people lost their properties and are rebuilding. Some lost their life. Hurricane Season is coming as it starts on June 1, 2019.

Colorado State University
13/5/2 ACE: 80

Joe Bastardi (Weather Bell)
10 to 15 Storms/4 to 7 Hurricanes/0 to 2 Major Hurricanes ACE: 60 to 110

Tropical Storm Risk
12/5/2 ACE: 81

Accuweather
10/5/3

Crown Weather
10/6/3

The Weather Channel
12/6/2

The analog years I am using are in which El Nino started late and is forecasted to be El Nino for the rest of the year to next year. Obviously, the forecast is uncertain.

Based on this, the analog years are 1940, 1969, 1987, 1992, 1993, and 2015. They are part of a multi-year El Nino or El Nino that is gone for a short time, only to return again later like in 1992 and 1993. 1940, 1969, 1987, and 2015 are multi-year El Nino. El Nino is not the only factor. I look at Atlantic Multidecadal Oscillation (AMO), Pacific Decadal Oscillation (PDO), Northeast Pacific Warm Pool (NEPWP), Equatorial Indian Ocean (EIO), Tropical South Atlantic (TSAI), Southern Ocean/Roaring Forties, Quasi-Biennial Oscillation (QBO), and Atlantic Main Development Region (MDR)

Analog Years For 2018 (TS/H/MH ACE ACE/Storm)
1940 9/6/0 68 7.6
1969 18/12/5 166 9.2
1987 7/3/1 34 4.9
1992 7/4/1 76 10.9
1993 8/4/1 39 4.9
2015 11/4/2 63 5.3

All of the seasons had major hurricane, except 1940. However, I consider that suspect because of no satellite back then. The most active is 1969 with 18 named storms, 12 hurricanes, and 5 major hurricanes. Many other forecasts have 1969 as an analog year.

Here are notable storms in the analog seasons.

1940
Hurricane #2 or the 1940 Louisiana Hurricane makes landfall as a Category 2 hurricane on Sabine Pass, Texas. The slow movement led to massive rainfall totals of up to 38 inches! Some areas likely saw over 40 inches of rain. 20,000 square miles was affected by heavy rain, which had an average of 12.10 inches! The storm set many state rainfall records for Louisiana, which still stand to this very day. However, some areas in Louisiana may have seen 40 inches of rain from Harvey.

Hurricane #3 or the 1940 South Carolina Hurricane hits South Carolina as a Category 2 hurricane as it made landfall on Beaufort, South Carolina. The storm dumps heavy rain of up to 21 inches triggering deadly mudslides in Appalachia. It is probable some areas saw 30 inches or greater. The widespread heavy rain triggers massive flooding. The storm claims a total of 52 lives.

Hurricane #4 or the 1940 New England Hurricane ravages New England before hitting Nova Scotia. The hurricane moisture and a stationary cold front leads to heavy rain over New Jersey including up to 24 inches, which is the wettest for the Garden State to this very day.

Hurricane #5 or the 1940 Nova Scotia Hurricane hits Nova Scotia just weeks after 1940 New England Hurricane. It hits Nova Scotia as a Category 1 hurricane. The hurricane caused shipping disruption in the North Atlantic. The hurricane causes damage in Nova Scotia and New Brunswick. There are three fatalities, in which two are off of America in ships.

1969
Hurricane Camille hit Cuba as a Category 2 hurricane. Than Camille underwent explosive intensification over the Gulf of Mexico. Camille had 900 millibars and 175 mph wind prior to making landfall on Mississippi Delta and Mississippi as a Category 5 hurricane. Gusts went high as 250 mph! The remants of Camille and cold front set off core rains over Western Virginia with extremely heavy rains centered over Nelson County, Virginia. Up 27 inches of rain was confirmed with a total as high as 31 inches in a barrel away from the center. It is probable up to 40 to 50 inches of rain fell in eight hours! Camille claimed 259 lives, mostly in Virginia from flooding.

Hurricane Francelia ravages Central America before making landfall on Belize. The slow moving hurricane dumped heavy rain over Guatemala, Nicaragua, and Honduras. The hurricane claims 271 lives, making it the deadliest prior to Mitch in 1998.

1987
Tropical Storm #2, which is the 1987 Gulf Coast Tropical Storm makes landfall on Texas, but most the heavy rain is east of the center. The Gulf Coast saw rain amount as high as 21 inches in Van Cleave, Louisiana.

Hurricane Emily hits Dominican Republic as Category 2 hurricane and emerges as a tropical storm. However, it undergoes rapid intensification to Category 1 hurricane of 90 mph and goes directly over Bermuda. Emily is the strongest hurricane to hit Bermuda since Hurricane #6 (Dog) or the 1948 Bermuda-Newfoundland Hurricane.

1992
Hurricane Andrew ravaged Bahamas and Florida as a Category 5 hurricane with 175 mph winds and 920 millibar pressure. It traversed over the Gulf of Mexico as a Category 4 hurricane before making landfall on Central Louisiana as a Category 3 hurricane. Once it was all done, South Florida was cut off from the world and did $27 billion in damages. Andrew was the costliest hurricane at the time prior to Katrina in 2005 and Harvey in 2017.

1993
Tropical Storm Arlene made landfall on Texas as a large tropical storm on June 19, 1993. It dumped heavy rain over a large area. The highest being over 15 inches of rain in Angleton. The system that became Arlene dumped heavy rain in El Salvador, which claimed 20 lives. There were five lives lost in Mexico. One died in Henderson, Texas. It claimed a total of 26 lives.

Tropical Storm Bret traveled across South America. It first made landfall on Galera Point, Trinidad and then goes over the Caribbean to make landfall on Macuro, Venezuela. It dumps heavy rain and triggers deadly mudslides. The highest measured is over 13 inches in Guanare with higher totals likely. Bret claims 173 lives in Venezuela, which is the deadliest along the 1999 Vargas Tragedy and 1967 Caracas Earthquake. The tropical storm goes over the Caribbean and makes landfall around Bahia Punta Gorda, Nicaragua. The storm dumps heavy rain over Central America, mainly in Nicaragua. The heavy rain leads to flooding and washes away villages. The storm claims 31 lives in Nicaragua. Bret goes over the East Pacific and becomes Hurricane Greg, which is a Category 4 hurricane.

Hurricane Emily is the only major hurricane of the 1993 Atlantic Season. It grazed North Carolina and came within 23 miles of Cape Hatteras, North Carolina on August 31, 1993. Emily moved eastward after it grazed North Carolina. The hurricane produced 10 feet storm surge in Buxton and dumped up to 7 inches of rain. Three people died from Emily.

Hurricane Gert made landfall on Bluefields, Nucaragua as it is ravaged from Bret as a tropical storm on September 15, 1993. It goes over Honduras as a tropical depression. Heavy rain falls over Nicaragua and Honduras, which leads to massive flooding. A total of 64 people die in Nicaragua and Honduras from Gert. Nearly 18 inches of rain falls in Corinto. Gert makes landfall as a tropical storm on Belize, affecting the Yucatan Peninsula. Gert emerges into the Gulf of Mexico as a tropical depression. From there, it becomes a Category 2 hurricane as it makes it final landfall north of Tuxpan as a Category 2 hurricane on September 20, 1993. Gert unleashes strong wind and heavy rain over Tamaulipas and Veracruz. The mountains see the heaviest rain with the highest total of over 31 inches in Aquismón with higher totals likely. The widespread rain leads to massive flooding that claims 45 lives in Mexico.

2015
Tropical Storm Bill made landfall on June 16, 2015 on Matagorda Island. Bill dumped heavy rain over Texas with a total of over 15 inches in Ganado, Texas. Bill weakens to a tropical depression and dumps heavy rain over Oklahoma with 8 inches of rain falling in Carter County. Bill claims 8 lives.

Tropical Storm Erika was a tropical storm that dumped heavy rain over Dominca. The mountainous terrain contribute to the heavy rain and deadly flooding and mudslide. Rainfall amount of 33 inches fell over Morne Diablotins. There was high precipitable water over Dominica. It was also north of the island. A total of 30 lives were lost in Dominica, which was the worst since Hurricane David in 1979.

Hurricane Joaquin is the strongest known Atlantic hurricane of non-tropical origin as it came from upper level low and surface low. Joaquin rapidly intensified into a Category 4 hurricane with 155 mph on October 2, 2015. It moved southwestward towards the Bahamas. It first made landfall as a Category 4 on Samana Cay and then Category 3 on Rum Cay and San Salvador Island. Strong winds, high waves, storm surge, and heavy rain pelt Bahamas. A 18 feet storm surge was reported in Long Island. As the Bahamas are being ravaged by Joaquin, the SS El Faro sinks into the abyss claiming all 33 on board. To make matters worse, there is a surface low of the coast of Georgia and Florida, which is drawing in moisture from Joaquin. The setup leads to widespread heavy rain over South Carolina and North Carolina. Nearly 27 inches of rain fell in Mount Pleasant, South Carolina. There is widespread flooding in South Carolina as there are 18 dam breaches from the heavy rain. The flood event in part from Joaquin claims 25 lives, including 19 in South Carolina.

Many of these notable storms in analog seasons were prodigious rainmakers. Some remain records yet to be broken. Some were intense like Camille and Andrew, which were Category 5 hurricanes and at landfall. I am not suggesting 2019 will see something like Camille, Andrew, 1940 Louisiana Hurricane, or Joaquin.

Here is a heat map of analog seasons. It is based on 300 mile radius from the storms.

The heat map shows the most active spot being off the Eastern US. Other hot spots are the Eastern Gulf Of Mexico, east of the Lesser Antilles, and off of Nicaragua and Costa Rica. However, when you look at the whole basin, everyone is at risk for landfall. I never make landfall predictions as I strongly object to doing landfall forecasts. The reason is everyone is at equal risk.

Analog
Mean
10/5.5/1.67
10/6/2 (Rounded Up)

Median
8.5/4/1
9/4/1 (Rounded Up)

Standard Deviation
4.2/3.33/1.75

ACE
Mean
74.33

Median
65.5

Standard Deviation
47.85

ACE/Storm
Mean
7.1

Median
6.4

Standard Deviation
2.54

How do analog seasons compare as a whole. Statistics from 1870 to 2018.

Mean
9.94/5.55/2.07
10/6/2

Median
10/5/2

Standard Deviation
4.24/2.63/1.68

ACE
Mean
93.34

Median
84

Standard Deviation
54.55

ACE/Storm
Mean
9.40

Median
8.67

Standard Deviation
4.03

The analog seasons are within standard deviation, which indicates this upcoming hurricane season is going to be within average.

What is my prediction for this season?
9 to 15 named storms, likely 12 named storms
5 to 10 hurricanes, likely 7 hurricanes
1 to 4 major hurricanes with 2 major hurricanes
ACE is 60 to 120 with ACE likely of 70 to 110

Let’s see how my April 2018 hurricane forecast compare to the actual 2018 season.

11 to 16 named storms, likely 13 named storms
4 to 10 hurricanes, likely 7 hurricanes
1 to 4 major hurricanes with 3 major hurricanes
ACE is 80 to 140 with ACE likely of 100 to 125

Colorado State University
14/7/3 ACE: 130

Joe Bastardi (Weather Bell)
10 to 12 Storms/4 to 6 Hurricanes/1 to 2 Major Hurricanes ACE: 90 to 110

Tropical Storm Risk
12/6/2 ACE: 84

Accuweather
10/5/3

The Weather Channel
12/6/2

2018 Actual Number
15 Named Storms
8 Hurricanes
2 Major Hurricanes
127 ACE

Many including myself got the forecast close. The 2018 Hurricane Season was forecasted about right, not over or under. There is always room for improvement.

Regardless of forecast, I think 2019 could be an interesting hurricane season.

Monsterous Michael Makes Landfall

History was made earlier today. Hurricane Michael made landfall as a Category 4 hurricane with 155 mph 135 knots 249 km/h. The highest wind on land is around 132 mph 115 knots 212 km/h with gusts as high as 198 mph 172 knots 319 km/h! It has a central pressure of 919 millibars and still intensifying! If it had been over water longer, it probably would of been a Category 5 hurricane. No doubt that Michael made history. Here is how Michael compares to past hurricanes.

Michael is the most intense Gulf Of Mexico hurricane since Rita (2005). Rita had a central pressure of 895 millibars with 180 mph 156 knots 290 km/h. Rita is the most intense Gulf Of Mexico hurricane recorded. There is no doubt there are stronger Gulf Of Mexico hurricanes that go unrecorded prior to the 19th century. Rita made landfall on the Texas and Louisiana border not before triggering a massive evacuation due to Katrina ravaging the Gulf Coast a month earlier. Michael is the most intense October Gulf Of Mexico hurricane since Opal (1995). Opal had a central pressure of 916 millibars and 150 mph 130 knots 241 km/h winds. Opal made landfall on Pensacola.

How does Michael stack up in terms of central pressure landfall for America and Atlantic Basin? Michael is the third most intense landfalling hurricane on America. Only the 1935 Labor Day and Camille have lower central pressures.

Rank Storm Landfall Pressure
1 Labor Day (1935) 892 mb
2 Camille (1969) 900 mb
3 Michael (2018) 919 mb
4 Katrina (2005)/Maria (2017) 920 mb
5 Andrew (1992) 922 mb
6 Indianola (1886) 925 mb
7 Guam (1900) 926 mb
8 Florida Keys (1919) 927 mb
9 Okeechobee (1928) 929 mb
10 Great Miami (1926)/Donna (1960) 930 mb

Michael has lower pressure than Katrina, Maria, and Andrew. Michael is the most intense Category 4 hurricane to make landfall on America. Katrina is the most intense Category 3 hurricane to make landfall on America. Katrina is much larger than Camille, Andrew, or Michael, which explains the low pressure and Category 3 winds. Texas’s most intense hurricane recorded is the 1886 Indianola Hurricane, which had a central pressure of 925 millibars. It is likely it had lower pressure. The 1900 Guam typhoon is the most intense typhoon recorded to hit Guam. It is very likely there have been more intense typhoons that hit Guam. Typhoons are often intense and often have lower pressure than the Atlantic. Category 5 typhoons happen every year. Let’s look at how Michael compares Atlantic Basin.

Rank Storm Landfall pressure
1 Labor Day (1935) 892 mb
2 Camille (1969)/Gilbert (1988) 900 mb
3 Dean (2007) 905 mb
4 Cuba (1924) 910 mb
5 Janet (1955)/Irma (2017) 914 mb
6 Cuba (1932) 918 mb
7 Michael (2018) 919 mb
8 Katrina 2005/Maria (2017) 920 mb
9 Bahamas (1932) 921 mb
10 Andrew (1992) 922 mb

Michael ranks seventh most intense basinwide hurricane landfall! The 1935 Labor Day Hurricane is still the most intense basinwide landfall. Camille (1969) and Gilbert (1988) tie as second most intense landfall basinwide. There is a unconfirmed report that the 1935 Labor Day Hurricane had pressure as low as 880 millibars! If that was true, it would be the most intense Atlantic hurricane, even surpassing Wilma!

Michael is one of the few Category 4 hurricanes to make landfall in October. Here is a list of hurricanes that made landfall on America in October.

1893 “Chenier Caminanda”
1898 Georgia Hurricane
1950 King
1954 Hazel

The last hurricane to make landfall on America as a Category 4 is Hazel in 1954. On top of it, Michael is a major hurricane over Georgia. The last time Georgia saw a major hurricane was in 1898! It is from the Georgia Hurricane.

History and statistics aside, we are going to be hearing and seeing a lot of destruction and likely more deaths from Michael. It could be a very costly hurricane for sure.

April 2018 Hurricane Season Forecast

Many areas are still reeling from Harvey, Irma, and Maria. Many people lost their properties and are rebuilding. Some lost their life. Hurricane Season is coming as it starts on June 1, 2018.

Colorado State University
14/7/3 ACE: 130

Joe Bastardi (Weather Bell)
11 to 15 Storms/5 to 7 Hurricanes/1 to 3 Major Hurricanes ACE: 90 to 110

Tropical Storm Risk
12/6/2 ACE: 84

Accuweather
12 to 15 Storms/6 to 8 Hurricanes/3 to 5 Major Hurricanes

The Weather Channel
13/7/2

The analog years I am using are in which previous winter is a weak to moderate La Nina. The forecast is uncertain with El Nino or Neutral.

Based on this, the analog years are 1891, 1945, 1963, 1989, 1996, 2001, 2006, and 2012. They are coming off of a La Nina. Of course, there are other factors in play besides El Nino. I look at Atlantic Multidecadal Oscillation (AMO), Pacific Decadal Oscillation (PDO), Northeast Pacific Warm Pool (NEPWP), Equatorial Indian Ocean (EIO), Tropical South Atlantic (TSAI), Southern Ocean/Roaring Forties, Atlantic Main Development Region (MDR), and Indian Ocean Dipole (IOD). The IOD is based on Australian Bureau of Meteorology forecast.

Analog Years For 2018 (TS/H/MH ACE ACE/Storm)
1891 10/7/1 116 11.6
1945 11/5/2 63 5.7
1963 9/7/2 118 13.1
1989 11/7/2 135 12.3
1996 13/9/6 166 12.8
2001 15/9/4 110 7.3
2006 10/5/2 79 7.9
2012 19/10/2 129 6.8

What affect did those analog seasons have? Let’s start with 1891. Hurricane #1 hit Galveston after intensifying into Category 2 hurricane with 100 mph winds on July 6, 1891. Galveston was flooded from storm surge. It spawned tornadoes in Baton Rouge, which hit a prison, killing 10 people. There is also Hurricane #3 better known as as the Martinique Hurricane was the only major hurricane for the 1891 season. It intensified into a Category 3 hurricane later that day and hit Martinique. There were reports of lightning, which suggests the hurricane was intensifying. Martinique was leveled by strong winds and power waves. Once the hurricane passed, at least 700 people died from the hurricane. Some put the death toll as high as 1,000. The hurricane traverses and makes landfall on Dominican Republic as a Category 2 hurricane. Than it goes northward towards Grand Turk of the Turks and Caicos Islands. The hurricane goes over Bahamas and makes landfall on South Florida as a Category 1 hurricane.

1945 had two major hurricanes hit the US. There is Hurricane #5 or 1945 Texas Hurricane. It made landfall as a Category 3 hurricane over Port Aransas on August 27, 1945. It was a slow moving hurricane as it moved slowly across Texas pelting with strong winds, storm surge, and heavy rain. Some areas saw storm surge as high as 15 feet. The moisture swath could be felt as far as Tampa Bay. The slow movement caused rainfall amounts of 20 inches with amounts likely over 30 inches. The hurricane claimed 3 lives and caused $20 million in damages. Hurricane #9 or 1945 Homestead hurricane is the most intense hurricane to strike Florida since the 1935 Labor Day Hurricane. It was a rather small hurricane. It went over Bahamas and Grand Turk Island as it intensifies. It made landfall on Key Largo as a Category 4 hurricane with 130 mph winds. It emerges out of Florida and makes landfall between Georgia and South Carolina as a tropical storm with 70 mph winds. A total of 26 people died, including 22 in Bahamas and Grand Turk Island. Four died in the US.

1963 was a devastating season. Hurricane Cindy developed in the Gulf of Mexico. It made landfall as a Category 1 hurricane on High Island on September 17, 1963. It stalls over Southeast Texas and dumps heavy rain in amounts of of nearly 24 inches measured. It is certainly possible higher rainfall amounts fell in East Texas. Cindy claimed 3 lives. Hurricane Flora is a large Category 4 hurricane. It was a Cape Verde Hurricane. Once it approached Haiti, Dominican Republic, Jamaica, and Cuba, it stalls out. Flora dumps extremely heavy rain, especially in mountainous areas. In a six day period, some areas see over 100 inches of rain in Cuba, with likely higher amounts. Flora is the wettest known Atlantic tropical cyclone. 8,000 people died from massive flooding from Flora. Flora ranks as one of the deadliest Atlantic hurricanes besides 1780 Hurricane, 1900 Galveston, Mitch (1998), and Fifi (1974).

1989 was an active season. Tropical Storm Allison, which formed from remnant of East Pacific Hurricane Cosme. Allison paid a visit to the Upper Texas Coast on June 27, 1989 with 50 mph wind. Many areas saw 10 to 20 inches with the highest being 30 inches. Eleven people lost their life in Texas Louisiana, and Mississippi. Hurricane Chantal and made landfall on High Island, Texas on August 1, 1989 as a Category 1 hurricane. Chantal produced three feet storm surge at Galveston. An area from Southern Harris County, Fort Bend, and Galveston County saw 8 to 12 inches of rain with amounts as high as 20 inches in Friendswood. Thirteen people die, including 11 offshore. Hurricane Hugo is the most intense hurricane of 1989, which peaked at 160 mph and central pressure of 918 millibars. Hugo first ravages the Caribbean as a monster hurricane. It flattens almost every building in Guadeloupe, Montserrat, St. Croix, and Puerto Rico. Hugo makes landfall as a Category 4 hurricane. Hugo produces monster storm surge in the Charleston area due to its large size. 35 people lost their life in America. Hurricane Jerry is the second hurricane to hit the Upper Texas Coast in 1989. Jerry makes landfall on Jamaica Beach. Galveston sees 75 mph winds with gusts as high as 100 mph. The storm surge destroys a section of State Highway 87. Houston does not feel much impact from Jerry due to it small size. Three people died from Jerry all in Galveston as they were driving on the Galveston Sea Wall.

1996 had many major hurricanes form, more so than 1995. Hurricane Bertha made landfall as a Category 2 hurricane on North Carolina on July 12, 1996. It peaked as a Category 3 hurricane near Puerto Rico. Bertha traversed across the Eastern Seaboard with heavy rain and strong winds. Bertha claimed 12 lives. Hurricane Cesar made landfall as a Category 1 hurricane on Bluefields, Nicaragua on July 27, 1996. It dumped heavy rain over Nicaragua, Costa Rica, and El Salvador. A total of 142 people, which includes 29 missing, mostly in Central America. Cesar crosses into the Pacific and becomes Douglas, which a rare crossover. Douglas is a power Category 4 hurricane. Hurricane Fran formed on August 23, 1996 as a Cape Verde Hurricane. It developed with Hurricane Edouard to the east. Fran becomes a Category 3 hurricane off the Bahamas and is a large hurricane. It made landfall on September 5, 1996 near Cape Fear, North Carolina as a Category 3 hurricane. Fran ravaged the Carolinas with strong winds, storm surge, and heavy rain. It moved northward towards Virginia as it is weakening. Fran becomes more of a rain event as winds are diminishing. Once Fran is gone, a total of 27 lives are lost. Hurricane Hortense formed on September 3, 1996. It was slow to develop and first strikes Guadeloupe as a tropical storm on September 8, 1996. It becomes a hurricane on September 9, 1996. Not too long after Hortense made landfall around Guánica, Puerto Rico as a Category 1 hurricane. It emerges and hits the eastern tip of Dominican Republic. As Hortense moves northward it becomes a Category 4 hurricane and makes its final landfall on West Quoddy, Nova Scotia as a Category 1 hurricane. Hortense dumped flooding rains in Puerto Rico. Hortense claimed a total of 39 lives. Hurricane Lili was a long lived hurricane that formed on October 14, 1996. It ravages Central America, Cuba, Bahamas, and United Kingdom. It made landfall on Matanzas Province, Cuba as a Category 2 hurricane on October 18, 1996. Than heads towards Bahamas where it goes over San Salvador Island and Great Exuma on October 19, 1996. Lili becomes a Category 3 hurricane. Than Lili hits United Kingdom as a strong extratropical storm. Once it is all over, 22 lives, mostly in Central America.

2001 started with Tropical Storm Allison. It made landfall on June 5, 2001 near Freeport, Texas. It lingered over Texas dumped heavy rain. On the early morning of June 7, 2001, heavy rain fell in Beaumon and Sugar Land, Texas. Up to 15 inches of rain fell along feeder band. Louisiana got heavy rain from the large circulation of Allison. Than on the evening of June 8, 2001, thunderstorms form near the center of Allison. Than they all converge over Houston dumping heavy rain for nearly 12 hours. Once it is all over, up to 28 inches fell! A total of 40 inches fell from June 5 to 10 near Beaumont, Texas. Thibodaux, Louisiana got nearly 30 inches of rain. The heavy rain led to severe flooding in Houston area, the worst prior to Harvey. Allison traversed across the Southeastern and Northeastern US dumping heavy rain. Hurricane Gabrielle formed on September 11, 2001, the day America was attacked in New York, Arlington, and Shanksville. It made landfall on September 14, 2001 near Venice, Florida as America was mourning the victims of horrifying terrorist attack. Hurricane Iris was a powerful October hurricane. Iris traveled the Caribbean and rapidly intensified into a Category 4 hurricane with 145 mph winds. On October 8, 2001, Iris makes landfall on Monkey River Town, Toledo, Belize. A 70 mile area is ravaged by strong winds and storm surge. The hurricane claimed 23 lives in Belize and 36 lives including Guatemala, Dominican Republic, and Mexico. Later in the month, Hurricane Michelle forms. Michelle formed near Nicaragua on October 29, 2001 and moved inland near Puerto Cabezas, Nicaragua. It lingered over Nicaragua and Honduras for more than a day dumping heavy rain. 98 people died in Nicaragua and Honduras from deadly flooding, which happened three years to the day Hurricane Mitch ravaged Central America with epic rainfall and flooding. Michelle exits Central America into the Caribbean. It undergoes rapid intensification into a Category 4 hurricane. Michelle makes landfall first on Cayo Largo del Sur, Cuba on November 4, 2001. It moves into Bay of Pigs. Cuba is ravaged by strong winds, waves, storm surge, and heavy rain. Five people died in Cuba from Michelle. Michelle moves northward towards Bahamas on November 5, 2001 and becomes an extratropical storm due to interaction with a cold front.

2006 was predicted to be just as active as 2005. Turned out to be an average season due to a developing El Nino and dry Saharan Desert air blowing over the Atlantic. Tropical Storm Alberto landfall on Florida on June 13, 2006 with 45 mph winds. Many areas in the Southeastern US, Grand Cayman, and Cuba have heavy rain. Two people died in Florida, and one died in North Carolina. Four sailors off the coast of Newfoundland Canada went missing when Alberto is an extratropical storm. Hurricane Ernesto formed west of Grenada on August 24, 2006. It becomes a hurricane southwest of Haiti on August 27, 2006 with 75 mph winds. Ernesto weakens as it interacts with the mountains of Haiti and Dominican Republic. Ernesto makes landfall on Cuba. Ernesto and Florida. Ernesto traverses over Florida be emerging over the Atlantic, which intensifies to 70 mph and possibly a Category 1 hurricane. Ernesto makes landfall on Oak Island, North Carolina on August 31, 2006. Five people died in Haiti, while two died in Virginia when Ernesto is an extratropical storm.

2012 proved to be an active season. Hurricane Isaac was a large Category 1 hurricane that hit New Orleans area and Mississippi. It moved slowly as it dumped heavy rain and produced high storm surge. A large area saw at least 10 inches of rain. The hurricane tested the newly improved levee and flood control system that was ravaged by Katrina in 2005. Hurricane Sandy is the most intense hurricane of the 2012 Atlantic Hurricane season. It is best known as Superstorm Sandy, when it was a very large hurricane/extratropical storm hybrid as it had tropical storm force winds diameter of 1,150 miles! Before it became the superstorm, it hit near Kingston, Jamaica as a Category 2 hurricane on October 24, 2012 and Santiago de Cuba, Cuba as a Category 3 hurricane on October 25, 2012. As it went towards the Atlantic, Sandy got larger as it showed more of an extratropical storm like appearance with a warm core. Than Sandy made landfall as a large extratropical storm with Category 1 winds on Brigantine, New Jersey on October 29, 2012. Sandy set numerous records from lowest air pressure to high storm surge. Battery Park, New York had nearly 14 feet storm surge. Sandy is the most hurricane to make landfall northeast of Cape Hatteras, North Carolina. It also dumped heavy rain mainly over Maryland and Delaware of nearly 13 inches of rain. Sandy claimed a total of 233 lives and did $68.7 billion in damages. Sandy was the second costliest hurricane prior to Harvey and Maria.

Here is a heat map of analog seasons. It is based on 300 mile radius from the storms.

The heat map has Upper Texas Coast, Southeast Georgia, Carolinas, and Windward Islands. However, when you look at the whole basin, everyone is at risk for landfall. I never make landfall predictions. Everyone is at equal risk for landfall.

Analog
Mean
12.25/7.38/2.63
12/7/3 (Rounded Up)

Median
11/7/2

Standard Deviation
3.33/1.85/1.60

ACE
Mean
114.50

Median
117

Standard Deviation
32.14

ACE/Storm
Mean
9.69

Median
9.75

Standard Deviation
3.03

How do analog seasons compare as a whole. Statistics from 1870 to 2017.

Mean
9.91/5.53/2.07
10/6/2

Median
9.5/5/2
10/5/2

Standard Deviation
4.24/2.63/1.69

ACE
Mean
93.09

Median
83.5

Standard Deviation
54.66

ACE/Storm
Mean
9.41

Median
8.68

Standard Deviation
4.04

The analog seasons are within standard deviation, which indicates this upcoming hurricane season is going to be within average.

What is my prediction for this season?
11 to 16 named storms, likely 13 named storms
4 to 10 hurricanes, likely 7 hurricanes
1 to 4 major hurricanes with 3 major hurricanes
ACE is 80 to 140 with ACE likely of 100 to 125

Let’s see how my April 2017 hurricane forecast compare to the actual 2017 season.

6 to 12 named storms, likely 10 named storms
3 to 8 hurricanes, likely 6 hurricanes
1 to 3 major hurricanes with 2 major hurricanes
ACE is 65 to 110 with ACE likely of 70 to 100

Colorado State University
11/4/2 ACE: 75

Joe Bastardi (Weather Bell)
10 to 12 Storms/4 to 6 Hurricanes/1 to 2 Major Hurricanes ACE: 75 to 95

Tropical Storm Risk
11/4/2 ACE: 67

Accuweather
10/5/3

The Weather Channel
12/6/2

2017 Actual Number
17 Named Storms
10 Hurricanes
6 Major Hurricanes
224 ACE

Many including myself severely underforecasted the 2017 season, which turned out to be active and brutal. The 2013 Atlantic Hurricane Season was overforecasted as it turned out to be a quiet season. There is always room for improvement.

Regardless of forecast, I think 2018 could be an interesting hurricane season. It is the same Atlantic name list used in the 2012 season, which produced Isaac and Sandy. Sandy is retired due to devastating effects on the Eastern Seaboard and Cuba.

2017-2018 Winter Forecast

Winter has started and Christmas has passed. It is very cold throughout America. Last winter we had a borderline Neutral/La Nina. This time around, we have La Nina. Other factors to consider are Pacific Decadal Oscillation (PDO), Atlantic Multidecadal Oscillation (AMO), Northeast Pacific Warm Pool (NEPWP), Equatorial Indian Ocean (EIOI), Indian Ocean Dipole (IOD), Tropical South Atlantic (TSAI), Roaring Forties (R40I), Hudson and Baffin Bay (HBB), and Quasi-Biennial Oscillation (QBO). However, since this El Nino is large and strong and has significant impact, it will weigh in more than other factors listed. Here are the analog winters I came up with.

1881-1882
1928-1929
1933-1934
1937-1938
1944-1945
1949-1950
1961-1962
1984-1985
2000-2001

I chose these winters because the previous winter was La Nina or Neutral. Here is a table I created to identify strongest analogs.

Year AMO PDO NEPWP EIOI IOD TSAI R40I HBB QBO Total
1881-1882     1 1 1   1     4
1928-1929 1 1     1     1   4
1933-1934 1 1 1 3
1937-1938 1 1 2
1944-1945 1 1 1 1   1 1 1   7
1949-1950 1 1 1   1 1     1 6
1961-1962 1 1 1     1 1     5
1984-1985       1 1 1 1   1 5
2000-2001 1 1 1 1 1 1 1   1 8

I look at eight ocean and one upper wind patterns based on Fall (September to November) averages. The cutoff for further analysis is four (before 1948 due to QBO data not available). With QBO, the cutoff is five. We can eliminate these winters.
1933-1934
1937-1938

The analogs I will be looking at are:
1881-1882
1928-1929
1944-1945
1949-1950
1961-1962
1984-1985
2000-2001

Let’s start with the ever important temperature. All maps were generated with 20th Century Reanalysis Monthly Composites. They are all Northern Hemisphere.

Alaska, Bering Sea, Southern US, Eastern US, Eastern Canada, Greenland, and Western China are warmer than normal. Arctic, Siberia, Korea, Japan, Central Asia, Southeast Asia, Europe, North Africa, Western US, and Western Canada are cooler than normal. Southeast Texas is warmer. Keep in mind, some areas do not have weather records, so this may be spurious as it includes 1881-1882.

Wonder what winter will be like in the rain department?

It is drier in Western US, Western Canada, Southeast US, Cuba, Bahamas, Southern China, Central Asia, Western Europe, and Northern Europe. It is wetter in Central US, Caribbean, Alaska, Northern Japan, Southeast Asia, and North Africa. Southeast Texas sees average amount of rain in the winter. Again, this may be spurious as it includes 1881-1882.

Let’s look at the upper air pattern.

There is upper level ridging south of Alaska, which is negative East Pacific Oscillation (EPO), Eastern US, Siberia, Greenland, and Northeast Canada. Ridging over Greenland and Northeast Canada is negative North Atlantic Oscillation (NAO). There is troughing over Central Canada and one running from Japan, Korea, and to all of Central Asia. Negative NAO and EPO usually means cold air will go down south.

How were winters like in these analog years?

1881-1882
A warm winter dominated the US. Southeast Texas had a warm winter.

1928-1929
A cold blast came on the start of 1929 in Southeast Texas. Another hard freeze came in February 1929. It did not go above freezing on February 9, 1929 with high of 29°F.

1944-1945
A world engulfed in World War II. No freezes occurred in Southeast Texas.

1949-1950
Most of the US had a warm winter, including Southeast Texas.

1961-1962
Snow fell in Houston area in December 1961. January 1962 had a strong cold blast in America. A strong high pressure with pressure of 1062 millibars was recorded. Many areas saw record lows set. Houston saw a record low on January 10, 1962, which has been beaten in 1977.

1984-1985
Cold blasts occurred in January and February 1985. The 1985 Presidential Inauguration was the coldest on record. Many areas saw record lows set. Houston saw record lows on January 20-21, 1985. Near records occurred on February 1-2, 1985. Snow fell in Houston in January and February 1985. San Antonio saw record snowfall on January 11-13, 1985.

2000-2001
Eastern US had a cooler than normal winter. Southeast Texas had a cold winter.

I am not suggesting we will see a cold blast on par with February 1929, January 1962, January 1985, and February 1985. It is possible this winter could see more cold blasts.

I think this winter could be a cooler winter despite what the past analog winters being warm. I would not be surprised to hear of a major cold blast this coming winter or snow falls again.

A New Normal Part 2

We are living in a new world and reality, a post-Harvey Texas. Just a week ago, a Category 4 monster, Hurricane Harvey was barreling down towards Rockport. Harvey was the first major hurricane to make landfall on America since Wilma in 2005. I think the National Hurricane Center (NHC) may increase Harvey’s peak to 140 mph 224 km/h 122 knots hurricane. Harvey being the first major hurricane to make landfall since Wilma has been largely overshadowed by the epic flooding that ravaged Houston and Beaumont area. That started on the night of August 26, 2017. A series of core rains that form near the center of Harvey.

One good news, the area of thunderstorms in the Southwest Gulf of Mexico does not pose a threat due to wind shear. It is an area of thunderstorms from a tropical wave. However, a cold front that is passing to Southeast Texas could set off thunderstorms and more rain as it picks up moisture from the tropical wave per NWS Houston.

000
FXUS64 KHGX 020220
AFDHGX

Area Forecast Discussion
National Weather Service Houston/Galveston TX
920 PM CDT Fri Sep 1 2017

.UPDATE...
Forecast for tonight looking on track. Updated temps and
dewpoints for trends.

Beat

&&

.PREV DISCUSSION... /ISSUED 628 PM CDT Fri Sep 1 2017/

AVIATION...
Sea breeze and outflow boundary are working their way inland with not
a whole lot of wind changes. SHRA activity that did develop late this
afternoon has now moved away from LBX. Look for light and variable
winds overnight with some patchy MVFR fog possible again at CXO. Expect
VFR conditions tomorrow with mainly light and variable winds. 42

PREV DISCUSSION... /ISSUED 343 PM CDT Fri Sep 1 2017/

DISCUSSION...
Current satellite is showing the typical afternoon cumulus field
developing across southeast Texas. There is a little enhanced
cumulus along the coast but the weak seabreeze is having trouble
generating enough lift for anything more than very isolated and
weak showers. This is expected again tomorrow and the dry weather
is greatly appreciated.

Models are still showing an upper level trough dropping into North
Texas tomorrow night though a significant change is a stronger
ridge over the southern Plains pinching the trough off from the
westerly flow and retrograding it back to the southwest earlier
than previous model runs. A more westerly position of this trough
means weaker lift and lower PoPs for Saturday night and Sunday.

Tropical moisture in the southern Gulf of Mexico will move north
early next week giving us our next decent chance for rainfall. At
the same time, a western U.S. ridge will amplify and northerly
upper flow will drive a cold front through the area Tuesday night
and early Wednesday. The tropical moisture already in place will
interact with this cold front producing a line of showers and
storms along the front. Fortunately the cold front will be moving
fairly quickly, especially for this time of year, pushing the rain
south by Wednesday afternoon. Behind the front, cool and dry air
will filter into the area bringing very pleasant temperatures with
highs only in the lower 80s Wed/Thu.

Hennig

There is also a tropical wave in the far eastern Atlantic that has a good chance of becoming Jose in the next five days. My main concern is Hurricane Irma, which is a Category 3 hurricane out in the Atlantic. Many are wondering where will Irma go. The latest heat map from various forecast models and GFS ensemble track guidance. The GFS goes up to 10 days.

Most forecast models have Irma moving west southwest direction in the next 5 days. From there, based on GFS ensembles, it could go anywhere. Some have Irma going into the Gulf of Mexico and hitting Louisiana in 10 days. Some have Irma hitting Florida to New York. This is too early too tell and this a low confidence forecast. Anything can happen between now and around September 11, which is the 16th anniversary of horrifying terrorist attacks that killed 3,000 people and destroyed the World Trade Center.

Many on social media may have seen this.

That is bogus. For one, the NHC does not issue forecasts 13 days in advance. They only go up to 5 days in advance. Nobody knows where Irma or any hurricane will go in the next 10 days, let alone 5 days.

The latest intensity forecast are in general agreement that Irma will be a major hurricane. A couple have Irma as a Category 2 fluctuating as Category 3, which happens due to eyewall replacement cycle.

I would not be surprised if Irma becomes a Category 5 hurricane, especially when it gets around the Caribbean. Hurricanes in that part of the Atlantic rarely become Category 5 hurricanes. Irma will have to be watched for September.