Harvey: 5 Years Later

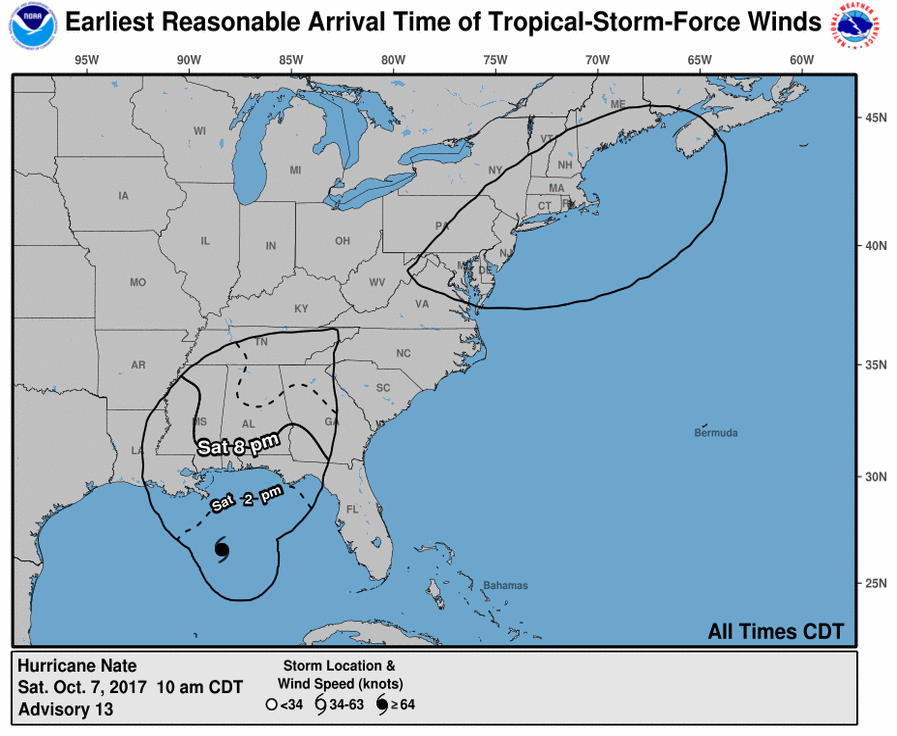
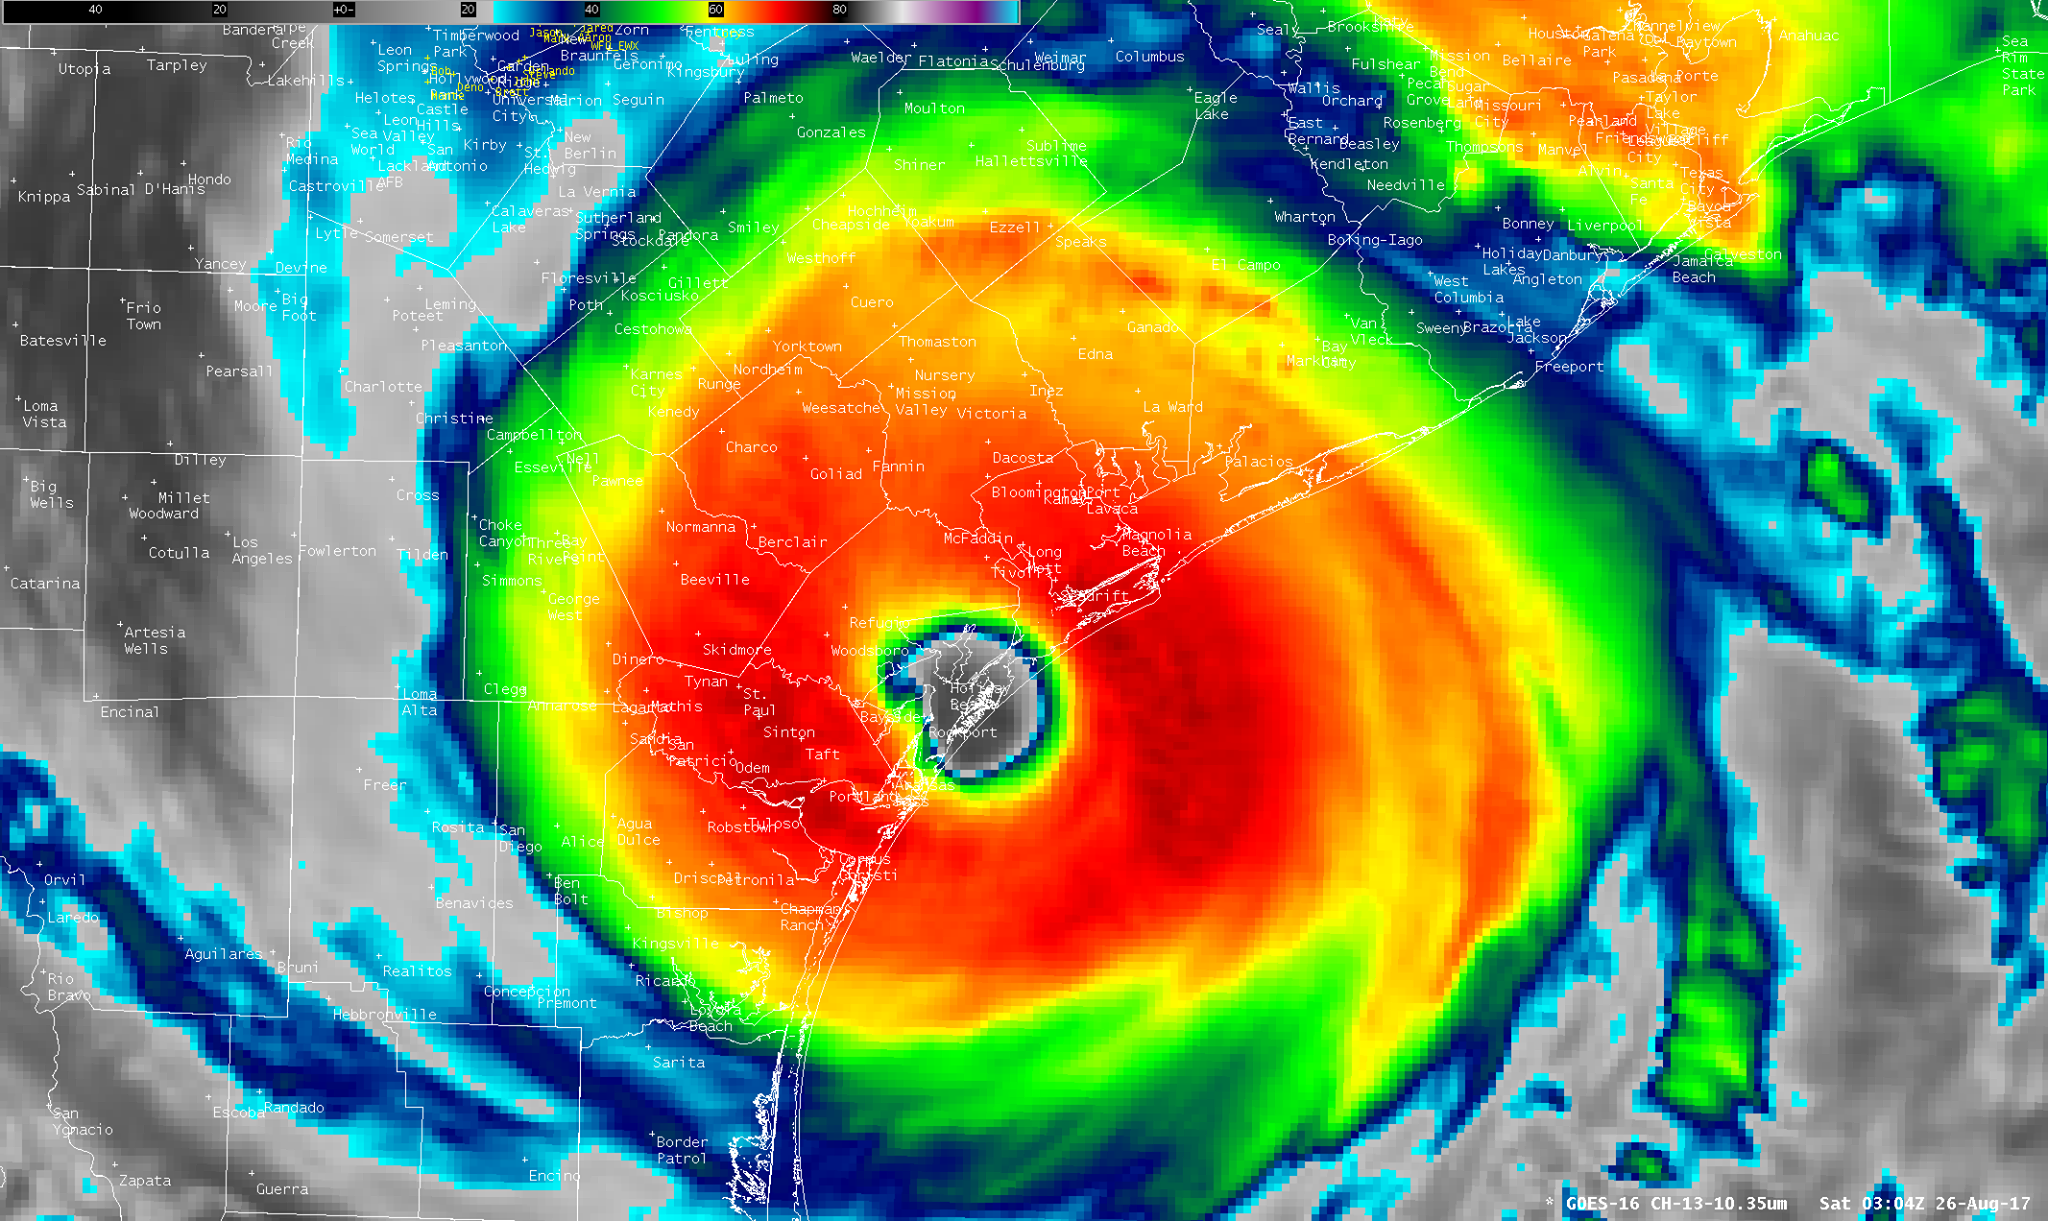
It is hard to believe, it has been five years since Hurricane Harvey made landfall near Port Aransas as a Category 4 hurricane with 130 mph winds. So much has happened since Harvey from COVID-19 Pandemic to Ukraine War. Harvey is the first major hurricane to make landfall on America since Wilma on October 24, 2005. Harvey made landfall on August 25, 2017. That is 43,23 days apart or 11 years, 10 months, 1 day or 142 months apart!

South Texas is hammered by strong wind, storm surge, and heavy rain. It packs a devastating punch. It is mainly along the coast in the Port Aransas area.

Port Aransas after Hurricane Harvey.
https://www.weather.gov/crp/hurricane_harvey

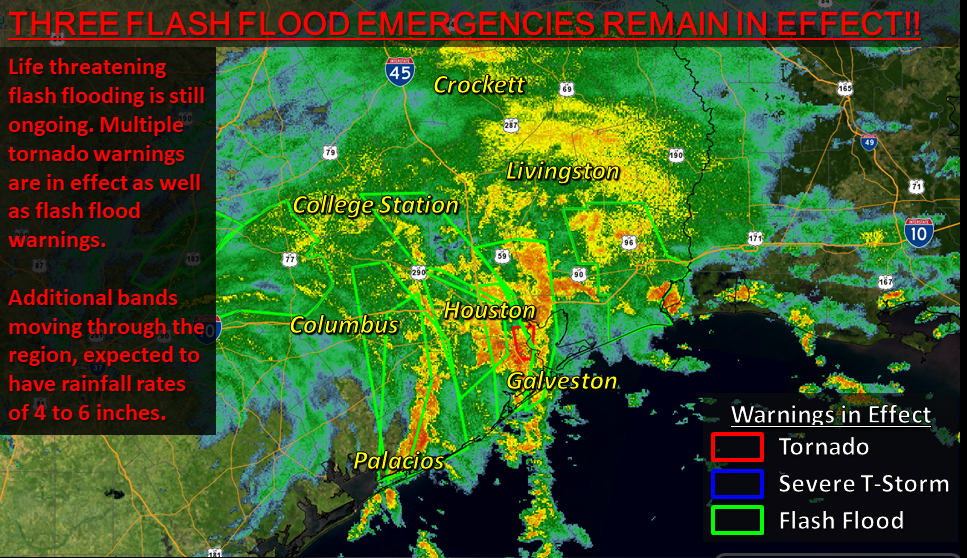
Once Harvey made landfall, it starts to weaken. Harvey is lingering over Texas. Large thunderstorms form near the center on the afternoon and evening of August 26, 2022. The large area of thunderstorms move toward Houston.

Doppler radar of Hurricane Harvey from National Weather Service.

The thunderstorms go over Houston area dumping heavy rain on the night of August 26, 2017 to the small hours of August 27, 2017. Heavy rain falls over and over on the Houston area.

NWS HGX Radar Showing Heavy Rain Falling Over the Area along with Active Warnings @ 4:07AM on 8/27/17
https://www.weather.gov/hgx/hurricaneharvey

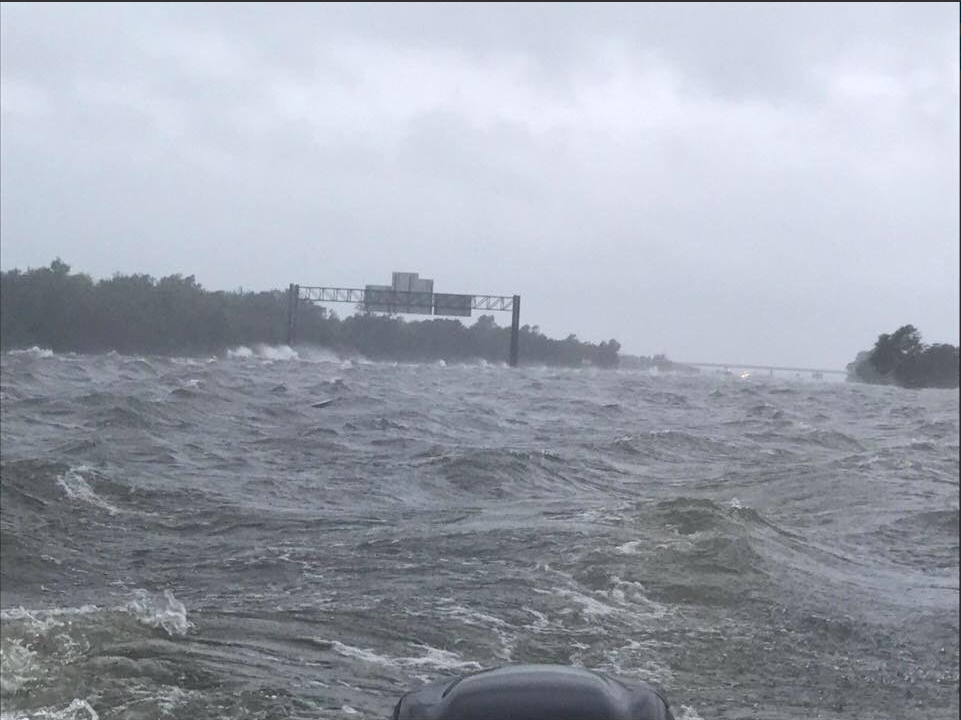
Houston area is flooded. Large areas receive 15 to 35 inches of rain from Harvey! Many houses and buildings are flooded as bayous and rivers are overflowing from heavy rain. Streets and freeways are flooded.

Flooding near Downtown Houston.
https://www.weather.gov/hgx/hurricaneharvey

Heavy rain continues to ravage Southeast Texas as Harvey lingers over Texas. Then Harvey exits Texas and goes over the Gulf of Mexico. Heavy rain falls over East Texas. Beaumont gets over 31 inches of rain including over 26 inches in a single calendar day on August 29, 2017!

I-10 at Jefferson/Chambers County Line via Dade Phelan
https://www.weather.gov/hgx/hurricaneharvey

Many areas saw over 30 inches of rain from Harvey. The highest recorded is 60.58 inches of rain in Nederland. Some areas likely got over 60 inches of rain. A Personal Weather Station (PWS) in Baytown recorded over 66 inches of rain during Harvey from August 25-31, 2017. The August 2017 total for that station is over 74 inches! I would not be surprised if some areas got up to 80 inches of rain from Harvey.

Once Harvey passed, it did $125 billion in damage, which is comparable to Hurricane Katrina in 2005. 103 people lost their life from Harvey in Texas. It is the deadliest Texas hurricane since 1919. The 1919 Florida Keys hurricane claimed at least 284 lives in Texas. It is likely up to 1,000 people died. It is probable more people died during Harvey, but were not counted.

A Look Back At The 2010s

As we enter the 2020s and bid adieu to 2010s, let’s look back at what is the biggest weather events of the decade from 2010 to 2019. It is hard to believe that 2010s went by fast. Time sure flies fast. I am going to go by death toll and scope of the event.

1.) 2010 Haitian Earthquake-Claimed 100,000 to 316,000 lives, making it one of the deadliest disasters in history. Haiti is one of the poorest nations in the world. The poor housing conditions make the death toll much higher. The earthquake flattens Port-au-Prince as the epicenter is just west of the city. The Haitian Earthquake is the deadliest disaster of the 2010s. It is also the deadliest disaster in the Western Hemisphere and Americas.
2.) 2011 Tōhoku Earthquake And Tsunami-A powerful earthquake sets off monster tsnuamis that inundate Japan. The tsunami claim 15,901 lives with 2,529 missing, which brings the death toll to as high as 18,430. It also causes Fukushima Daiichi nuclear disaster, in which three reactors explode. Fukushima is the worst since Chernobyl in 1986. Radiation levels are higher than normal throughout the Pacific Ocean, especially around Japan and Korea. The Tōhoku Earthquake And Tsunami is the second deadliest disaster of the 2010s.
3.) 2015 Gorkha Earthquake-Struck Nepal with the epicenter in the Himalayas. The earthquake is felt in India, China, and Bangladesh. It flattens Kathmandu and did $10 billion of damages or half of Nepal’s GDP. The earthquake claims 8,964 lives. To make matters worse, a strong aftershock strike a month after the April earthquake. It claims 218 lives. The 2015 Gorkha Earthquake is the third deadliest disaster of 2010s.
4.) Super Typhoon Haiyan-The super typhoon makes landfall on Leyte, Philippines as a powerful Category 5 super typhoon. The storm inundates with massive storm surge that behave more like tsunamis. Most of the death are from deadly storm surge as it claims 6,352 lives and leave 1,071 missing. That brings the death toll as high as 7,423. Haiyan is the deadliest tropical cyclone of the 2010s. It is the fourth deadliest disaster of the 2010s.
5.) 2018 Sulawesi Earthquake And Tsunami-A strong earthquake strike Sulawesi, Indonesia, which set off tsunami despite being a strike-slip earthquake. They do not produce large tsunami. The earthquake likely triggers a underwater landslide and rise of the seafloor, which made the tsunami more likely. The tsunami claims 4,340 people with 667 missing. The death toll could be as high as 5,007.
6.) Hurricane Maria-Makes landfall as a strong Category 4/5 hurricane on Puerto Rico. It ravages Puerto Rico with strong winds, high waves, storm surge, and heavy rain of up to 39 inches. The hurricane destroy most of Puerto Rico’s infrastructure and cut off communications. Once Maria passes, a total of 3,059 lives are lost, including 2,975 lives in Puerto Rico. 65 people remain missing, which may bring the death toll to 3,124. It is also the second costliest Atlantic hurricane after Katrina and Harvey.
7.) Cyclone Idai-The deadly tropical cyclone makes landfall on Mozambique as a Category 3 tropical cyclone. It ravages Mozambique with strong winds, heavy rain, high waves, and storm surge. As it traverses over Mozambique, it goes into Zimbabwe. It dumps heavy rain over a large area leading to massive flooding. Once Idai fizzles out, it claims 1,303 lives and leaves at least 2,262 missing. The number of missing is high in Momzambique, which brings the death toll to at least 3,565. Idai is the deadliest African and Southwest Indian Ocean tropical cyclone. It is the second deadliest tropical cyclone in the Southern Hemisphere after the 1973 Flores Cyclone, which struck Flores Island.
8.) Hurricane Harvey-This devastating hurricane made landfall on Texas as a Category 4 hurricane. It is the first major hurricane to make landfall on the Continental US since Wilma in 2005. The hurricane lingers over Texas for the next five days dumping heavy rain over a large area of Texas and Louisiana. Harvey dumps up to 70 inches of rain once it is all over. The deluge claims 107 lives including 103 in Texas. Harvey does $125 billion in damages, which ties with Katrina in 2005.
9.) Hurricane Dorian-The powerful Category 5 hurricane ravage Bahamas with powerful winds, heavy rain, high waves, and massive storm surge for couple of days. The Bahamas experience major hurricane force winds for a couple of days. Many buildings are destroyed and people are swept out to the ocean. Once Dorian left Bahamas, it heads for the US. Dorian makes landfall on North Carolina as a Category 2 hurricane. Once it is all over, 80 people die, including 70 in the Bahamas. There are 282 people missing in the Bahamas, which likely brings the death toll to 352. However, the death toll is likely higher with many unaccounted for due to deadly storm surge and waves.
10.) Hurricane Michael-The hurricane made landfall as a Category 5 on the Florida Panhandle. The last time a Category 5 hurricane made landfall on the Lower 48 is Andrew in 1992. Michael produces deadly storm surge that flatten Mexico Beach. Once Michael passes, it claims 74 lives, including 59 in Florida.

Honorable Mentions
2011 Super Outbreak-Largest tornado outbreak since 1974. Epic tornado outbreak strikes the South, Midwest, and Northeast with monster tornadoes. The tornado outbreak produces 360 tornadoes and claims 324 lives including 24 who are not killed by tornadoes. The super outbreak claims 348 lives, mainly in Alabama.
2011 Joplin Tornado-Monster tornado strikes Joplin, which is an EF-5. EF-5 is the strongest tornado. The monster tornado flattens a large area of Joplin. Once the tornado passes, it claims 158 lives and eight indirectly, bringing the death toll to 166.
Hurricane Sandy-First made landfall on Cuba as a Category 3 hurricane. It expands and becomes Super Storm Sandy before making landfall near Atlantic City. It ravages the entire East Coast with strong wind, heavy rain, snow, and storm surge. The New York City area is flooded by storm surge from Sandy. Snow fall over the mountains of North Carolina and West Virginia. Once Sandy passes, 233 people die, including 157 in America, mainly in New York and New Jersey.
Super Typhoon Bopha-The super typhoon makes landfall on Baganga, Mindanao, Philippines as a power Category 5 super typhoon. It ravages Mindanao with strong winds, heavy rain, and high waves. Many areas are flooded from the Bopha. Bopha claims 1,901 lives, making it one of the deadliest Philippine typhoons.
Hurricane Florence-Hurricane Florence is a Category 4 hurricane that makes landfall as a Category 1 hurricane on Wrightsville Beach, North Carolina. It lingers over North Carolina dumping heavy rain in excess of 36 inches. It leads to massive flooding in North Carolina and South Carolina. Once it is all over, Florence claims 54 lives.
Super Typhoon Yutu-It makes landfall as a Category 5 Super Typhoon on Tinian, Saipan. It happens two weeks after Category 5 Hurricane Michael made landfall on Florida. Two people die in Saipan from Yutu. Yutu made moved westward and makes landfall on Isabella, Philippines as a Category 3 typhoon claiming 27 lives.
Tropical Storm Imelda-Imelda suddenly forms south of Galveston. It makes landfall near Freeport as a tropical storm. Imelda lingers over Texas for the next two days dumping over 43 inches of rain! It leads to massive flooding in Southeast Texas as they are still recovering from Harvey. Imelda claims five lives.

These are the top 10 weather events of the 2010s I included honorable mentions. They are based on death toll and scope of the disaster. Haitian Earthquake is the deadliest disaster of the 2010s. The Japanese Tsunami did a lot of damage and led to Fukushima Disaster, which is the worst since Chernobyl. The Nepal Earthquake cost half of Nepal’s economy. Harvey flooded out the Houston area with heavy rain that lasted for days.

2017-2018 Winter Forecast

Winter has started and Christmas has passed. It is very cold throughout America. Last winter we had a borderline Neutral/La Nina. This time around, we have La Nina. Other factors to consider are Pacific Decadal Oscillation (PDO), Atlantic Multidecadal Oscillation (AMO), Northeast Pacific Warm Pool (NEPWP), Equatorial Indian Ocean (EIOI), Indian Ocean Dipole (IOD), Tropical South Atlantic (TSAI), Roaring Forties (R40I), Hudson and Baffin Bay (HBB), and Quasi-Biennial Oscillation (QBO). However, since this El Nino is large and strong and has significant impact, it will weigh in more than other factors listed. Here are the analog winters I came up with.

1881-1882
1928-1929
1933-1934
1937-1938
1944-1945
1949-1950
1961-1962
1984-1985
2000-2001

I chose these winters because the previous winter was La Nina or Neutral. Here is a table I created to identify strongest analogs.

Year AMO PDO NEPWP EIOI IOD TSAI R40I HBB QBO Total
1881-1882     1 1 1   1     4
1928-1929 1 1     1     1   4
1933-1934 1 1 1 3
1937-1938 1 1 2
1944-1945 1 1 1 1   1 1 1   7
1949-1950 1 1 1   1 1     1 6
1961-1962 1 1 1     1 1     5
1984-1985       1 1 1 1   1 5
2000-2001 1 1 1 1 1 1 1   1 8

I look at eight ocean and one upper wind patterns based on Fall (September to November) averages. The cutoff for further analysis is four (before 1948 due to QBO data not available). With QBO, the cutoff is five. We can eliminate these winters.
1933-1934
1937-1938

The analogs I will be looking at are:
1881-1882
1928-1929
1944-1945
1949-1950
1961-1962
1984-1985
2000-2001

Let’s start with the ever important temperature. All maps were generated with 20th Century Reanalysis Monthly Composites. They are all Northern Hemisphere.

Alaska, Bering Sea, Southern US, Eastern US, Eastern Canada, Greenland, and Western China are warmer than normal. Arctic, Siberia, Korea, Japan, Central Asia, Southeast Asia, Europe, North Africa, Western US, and Western Canada are cooler than normal. Southeast Texas is warmer. Keep in mind, some areas do not have weather records, so this may be spurious as it includes 1881-1882.

Wonder what winter will be like in the rain department?

It is drier in Western US, Western Canada, Southeast US, Cuba, Bahamas, Southern China, Central Asia, Western Europe, and Northern Europe. It is wetter in Central US, Caribbean, Alaska, Northern Japan, Southeast Asia, and North Africa. Southeast Texas sees average amount of rain in the winter. Again, this may be spurious as it includes 1881-1882.

Let’s look at the upper air pattern.

There is upper level ridging south of Alaska, which is negative East Pacific Oscillation (EPO), Eastern US, Siberia, Greenland, and Northeast Canada. Ridging over Greenland and Northeast Canada is negative North Atlantic Oscillation (NAO). There is troughing over Central Canada and one running from Japan, Korea, and to all of Central Asia. Negative NAO and EPO usually means cold air will go down south.

How were winters like in these analog years?

1881-1882
A warm winter dominated the US. Southeast Texas had a warm winter.

1928-1929
A cold blast came on the start of 1929 in Southeast Texas. Another hard freeze came in February 1929. It did not go above freezing on February 9, 1929 with high of 29°F.

1944-1945
A world engulfed in World War II. No freezes occurred in Southeast Texas.

1949-1950
Most of the US had a warm winter, including Southeast Texas.

1961-1962
Snow fell in Houston area in December 1961. January 1962 had a strong cold blast in America. A strong high pressure with pressure of 1062 millibars was recorded. Many areas saw record lows set. Houston saw a record low on January 10, 1962, which has been beaten in 1977.

1984-1985
Cold blasts occurred in January and February 1985. The 1985 Presidential Inauguration was the coldest on record. Many areas saw record lows set. Houston saw record lows on January 20-21, 1985. Near records occurred on February 1-2, 1985. Snow fell in Houston in January and February 1985. San Antonio saw record snowfall on January 11-13, 1985.

2000-2001
Eastern US had a cooler than normal winter. Southeast Texas had a cold winter.

I am not suggesting we will see a cold blast on par with February 1929, January 1962, January 1985, and February 1985. It is possible this winter could see more cold blasts.

I think this winter could be a cooler winter despite what the past analog winters being warm. I would not be surprised to hear of a major cold blast this coming winter or snow falls again.

Nate Is Edging Closer To The Gulf Coast

Nate is now a Category 1 hurricane with 90 mph 144 km/h 78 knots wind. Further strengthening is possible with Nate. The question is how strong will Nate be by landfall.

Most forecast models have Nate intensifying into Category 2 with one intensifying into Category 3 hurricane. I would not be surprised if Nate becomes a Category 3 hurricane upon landfall. Category 4 or 5 is highly unlikely as it is moving quickly at 26 mph 42 km/h 22.6 knots. Here is a forecast model of where Nate will possibly make landfall. The heat map is from within 300 miles (480 kilometers) of a point.

There is a consensus that Nate could make landfall southwest of New Orleans to Pensacola area. It is unlikely Nate could deviate and hit Harvey ravaged Texas Coast. At this rate, Nate could make landfall later tonight or early tomorrow morning. Tropical storm force winds could start later this afternoon to evening.

Nate is not a large hurricane. Here is a wind radii map of Nate.

Hurricane force winds are only on the east side of Nate. Hurricane force winds are up to 69 miles 110.4 km 60 nautical miles across from northeast to southeast quadrant. Tropical storm force winds are are up to 230 miles 368 km 200 nautical miles across from northeast to southeast quadrant. However, since Nate is moving quickly, hurricane force winds maybe felt up to nearly three hours on the eastern side of Nate. Tropical storm force winds maybe felt up to nine hours.

The motion Nate is moving at, many areas could see 4 to 8 inches/10.2 to 20.3 centimeters of rain with isolated totals as high as 12 inches/30.5 centimeters. The forward motion should keep inland flooding risk low at this time.

Here is what I think will happen.
-Nate will make landfall somewhere along the Gulf Coast.
-Coastal flooding will be the main problem.

The forecast models came from NCAR-Tropical Cyclone Guidance and National Hurricane Center. Special thanks to all of them.

Tropical Depression 16 (Future Nate)

Tropical Depression 16 just formed. It could be Nate soon. It is October and it can be active. October has produce some very intense hurricanes like Great Hurricane Of 1780, 1924 Cuba Hurricane, Hattie, Opal, Mitch, Wilma, and Matthew. In fact some of the most intense tropical cyclones known have occurred in October like Tip, Patricia, Wilma, and 1999 Odisha Cyclone. They are the most intense tropical cyclones in their basin in the Northern Hemisphere! Here is the heat map forecast from various forecast models and GFS ensemble track guidance for Tropical Depression 16. The heat map is from within 300 miles (480 kilometers) of a point.

Most of the forecast models suggest that Tropical Depression 16 may go over Central America and then go over the Caribbean. From there, it enters the Gulf of Mexico. This is what concerns me.

The Northwest Caribbean off the coast of Belize and Yucatan Peninsula is very warm. If conditions are right in the atmosphere, Tropical Depression 16 or future Nate could undergo rapid intensification. Warm water is not the only factor that allows hurricanes to rapidly intensify. If the upper air is favorable like more humidity and less wind shear combined with warm water, it could allow rapid intensification. This is the same area where Wilma became the most intense hurricane in the Atlantic. Here is the intensity forecast.

Only one forecast model has future Nate as a major hurricane. Forecasting strength and intensity is notoriously difficult. I would not be surprised if Tropical Depression 16 or future Nate becomes a major hurricane.

Here is what I think will happen.
-Nate will form as early as Thursday.
-Caribbean and Gulf of Mexico needs to watch.

The forecast models came from NCAR-Tropical Cyclone Guidance and Tropical Cyclone Heat Potential. Special thanks to all of them.

Puerto Rico In Trouble

Hurricane Maria is a very dangerous Category 5 hurricane with 175 mph 280 km/h 152 knots. It has a central pressure of 909 millibars (mb). This is more intense than Hurricane Irma in terms of central pressure. Maria is now the top 10 most intense Atlantic hurricane known. I mean known as records go back to 1851.

Top 10 Most Intense Hurricane By Central Pressure
1.) Wilma 2005 882 mb
2.) Gilbert 1988 888mb
3.) Labor Day 1935 892 mb
4.) Rita 2005 895 mb
5.) Allen 1980 899 mb
6.) Camille 1969 900 mb
7.) Katrina 2005 902 mb
8.) Mitch 1998/Dean 2007 905 mb
9.) Maria 2017 909 mb
10.) Cuba 1932/Ivan 2004 910 mb

Wilma is the most intense hurricane to date. It ravaged Yucatan Peninsula and Florida. Gilbert and Rita caused a huge scare for Texas. Gilbert hit Jamaica, Yucatan Peninsula, and Mexico’s Gulf Coast. Rita hit east of Houston area in East Texas and Southwest Louisiana. Labor Day 1935 Hurricane likely had low central pressure. Allen made landfall on South Texas. Camille and Katrina ravaged the Gulf Coast in the same area. Katrina was larger as it produced higher storm surge in Mississippi and flooded out New Orleans. Mitch killed 22,000 from heavy rain and massive flooding in Central America. Mitch is the deadliest hurricane after the Great Hurricane of 1780, which claimed 30,000 lives. Dean hit Yucatan Peninsula and Mexico. Cuba 1932 is Cuba’s deadliest hurricane to this day. Ivan ravaged the the Caribbean before making landfall on Alabama and Florida. Ivan came back again and made landfall as a tropical storm on Texas/Louisiana border. That being said, Maria is getting ever so closer to St. Croix and Puerto Rico.

Doppler radar image out of Puerto Rico shows a formidable Hurricane Maria. Not often we see a Category 5 hurricane on ground based Doppler radar. It has a near prefect circular eye. The infrared satellite image of Hurricane Maria is very impressive and scary. It is going to be a rough night for St. Croix.

St. Croix is experiencing tropical storm force winds. Hurricane force winds should be later tonight for St.Croix. Puerto Rico should feel tropical storm force winds later tonight. Hurricane force wind comes early tomorrow morning. Hurricane force winds are up to 104 miles 166 km 90 nautical miles across from northwest to northeast quadrant. Tropical storm force winds are are up to 276 miles 442 km 240 nautical miles across from northwest to northeast quadrant. It has gotten larger from yesterday. The speed Maria is moving at, 10 mph 16 km/h 8.7 knots, tropical storm force winds could last up to nearly 28 hours, while hurricane force winds could last up to 10 hours. This prolonged wind could do a lot of damage for Puerto Rico and St. Croix.

Here is the heat map forecast from various forecast models and GFS ensemble track guidance for Maria up close with Puerto Rico.

It does not look good for Puerto Rico. Most of the forecast models have Maria making landfall and going over Puerto Rico. The intensity as it is is very concerning. I would not be surprised if Maria intensifies further right before it gets close to Puerto Rico later tonight. This is a very bad for Puerto Rico. If Hurricane Maria makes landfall as a Category 5 on Puerto Rico, it will be the first since 1928, the Okeechobee Hurricane. On September 13, 1928, the Okeechobee Hurricane made landfall on Puerto Rico as a Category 5 hurricane with 160 mph 256 km/h 139 knots. The gusts are as high as 240 mph 384 km/h 209 knots. It had a central pressure of 929 millibars. It was very likely the central pressure was lower and stronger. The hurricane was large as it ravaged Puerto Rico. The hurricane claimed 312 lives in Puerto Rico, while 1,200 lives were lost at Guadeloupe. The Okeechobee Hurricane made landfall near West Palm Beach as a Category 4 hurricane with 145 mph 232 km/h 126 knots on September 17, 1928. The highest wind on land would be around 123 mph 200 km/h 107 knots with gusts as high as 185 mph 296 km/h 161 knots. The hurricane stayed over Florida and claimed at least 2,500 lives and likely more. The Okeechobee Hurricane claimed more than 4,000 lives. The death toll is likely much higher. It is America’s deadliest hurricane since 1900 Galveston Hurricane that claimed 12,000 lives. In fact, Okeechobee Hurricane is the deadliest American disaster prior to 9/11 and Hurricane Katrina.

Once Maria passes Puerto Rico, where does it go?. This is the latest heat map from various forecast models and GFS ensemble track guidance for Maria. The GFS goes up to 10 days.

The forecast models have a westward trend from 24 hours ago. Dominican Republic and Bahamas could feel the impact of Maria. There is also a possibility that Maria could affect North Carolina and the Eastern Seaboard. That would be too early to tell at this time. This is on top of how strong Maria will be.

Most of the forecast models have Maria weakening after it passes Puerto Rico. One model has Maria intensifying back to a Category 5 hurricane in three days. Intensity forecast are notoriously difficult to forecast. All the forecast models are subject to change.

Here is what I think will happen.
-Maria could pose a major threat to Puerto Rico.
-Maria will likely impact Dominican Republic.

This is going to be very bad for Puerto Rico and St. Croix. I fear the damage will be epic and the death toll could be high. This comes at a bad time as Puerto Rico is mired in a serious financial crisis. This could make recovery difficult for Puerto Rico. I cannot imagine what it will be like during Hurricane Maria.

The forecast models came from NCAR-Tropical Cyclone Guidance, NOAA Tropical Cyclone Imagery – Storm Floaters, National Hurricane Center, and National Weather Service. Special thanks to all of them.

Double Trouble!

The Natonal Hurricane Center (NHC) has confirmed that Hurricane Maria made landfall as a formidable Category 5 hurricane with 160 mph 256 km/h 139 knots wind. Gusts can go as high as 240 mph 384 km/h 209 knots! It has a central pressure 924 millibars. Maria is the second Category 5 hurricane of 2017 for the Atlantic. The last time there were more than one Category 5 hurricane was in 2007 with Dean and Felix. 2005 had four Category 5 hurricanes; Emily, Katrina, Rita, and Wilma. This is going to be a very long night for the people of Dominica. I cannot imagine what it is like to be under a Category 5 monster. Strong and howling winds and buildings getting destroyed.

The hurricane force winds is going to engulf most if not all of Dominica.

Hurricane force winds are up to 58 miles 93 km 50 nautical miles across from northwest to northeast quadrant. It is moving at 9 mph 14 km/h 7.8 knots, which means they will have to endure hurricane force winds for about 6 hours! That is a very prolonged, which increases chance for great carnage in Dominica. At that speed, Hurricane Maria will dump between 8 to 12 inches/20.3 to 30.5 centimeters of rain. Some areas could see as much as 20 inches/50.8 centimeters of rain.

The big question is where the Maria go after ravaging Dominica. This is the latest heat map from various forecast models and GFS ensemble track guidance for Maria. The GFS goes up to 10 days.

Once Maria passes Dominica, Maria may go over St. Kitts, Nevis, Montserrat, U.S. Virgin Islands, British Virgin Islands, and Puerto Rico. Those areas have been ravaged by Hurricane Irma. They do not need another monster hurricane ravaging them again. Some of the forecast models put it over Puerto Rico sometimes by this Wednesday. If Maria goes over Puerto Rico, it would be a very bad disaster for the island, which is mired in a financial crisis. That will make things much worse than it is. After Puerto Rico, most forecast models have Maria going northwestward. Some have it going to the Bahamas. At this point, Maria should not be a threat to the Gulf of Mexico. That can change of course. Not something we need after Harvey and Irma. The next question is how strong will Maria be.

Most forecast models show Maria weakening to Category 4 within 36 hours. Intensity forecast is notoriously difficult. It is possible Maria could be a Category 5 hurricane by the time it hits Puerto Rico. That will make things much worse as it is. Most forecast model a weakening trend as it turns northwest. The waters north of Puerto Rico are cooler due to Hurricane Irma.

Hurricane Irma became a Category 5 in warm waters, not the warmest. The warmest waters are in the Western Caribbean between Cuba, Central America, and Yucatan Peninsula. If Maria went over that water, it would probably be more intense than Wilma in 2005.

Another hurricane I am watching is Jose. It is off the Eastern Seaboard of America. Where it goes is rather complicated. This also complicates on where Hurricane Maria ultimately goes. This is the latest heat map from various forecast models and GFS ensemble track guidance for Jose. The GFS goes up to 10 days.

The forecast models are all over where Hurricane Jose goes. Looks like Jose is likely to linger over the Atlantic. Some have it going towards Florida or New Jersey. The heat map suggests this is a low confidence forecast. Since Jose is at a more northern latitude away from the tropics, it has gotten larger as energy is spread out more.

Hurricane force winds are up to 115 miles 184 km 100 nautical miles across from northwest to northeast quadrant. There is no hurricane force winds on the southern half of Jose. Tropical storm force winds are up to 449 miles 718 km 390 nautical miles from northeast to southeast quadrant. This a lop sided hurricane. Here is the most recent intensity forecast for Jose.

Most forecast models have Jose weakening into a tropical storm in the next five days. Jose will likely become extratropical in the several days. Hurricane Jose does not look like a hurricane from satellite.

Looks more like an extratropical storm than a hurricane to me.

Here is what I think will happen.
-Maria could pose a major threat to Puerto Rico.
-Jose is likely to linger over the Atlantic.

The forecast models came from NCAR-Tropical Cyclone Guidance, NOAA Tropical Cyclone Imagery – Storm Floaters, National Hurricane Center, Tropical Cyclone Heat Potential, and Meteo-France. Special thanks to all of them.

Irma Ravages Florida Part 2

The National Hurricane Center (NHC) has Hurricane Irma is near Tampa and it is a Category 2 hurricane with 100 mph 160 km/h 87 knot winds, which is on land 85 mph 136 km/h 74 knots. Gusts are as high as 128 mph 205 km/h 111 knots. Hurricane force winds are up to 150 miles 240 km 130 nautical miles across from northeast to southeast quadrant. Tropical force winds are up to 690 miles 1,104 km 600 nautical miles across from northwest to northeast quadrant. It is a large hurricane!

Tropical storm force winds are engulfing a large portion of Florida. It is even felt in Georgia and South Carolina! That is how large Irma is. Irma got large because it is over land, which disrupts the core. There is also a cold front. Those two make Irma larger as energy is spread out. The same reason why Ike got larger before making landfall on Texas in 2008.

Irma continues to get closer to Tampa. Here is the forecast model of where Irma will go. This is the latest heat map from various forecast models and GFS ensemble track guidance for Irma. The GFS goes up to 10 days.

Interesting to note there is not much of a consensus of where Irma will go. Interestingly, there appears to be some cluster where Irma will go in the next five days. Looks like Irma may end up over Tennessee, Kentucky, Mississippi, Alabama, Arkansas, Indiana, and Illinois.

Here is what I think will happen.
-Tampa Bay Area will be ravaged by Irma.
-Storm surge and strong winds will be the main issue.
-Flooding from storm surge and heavy rain will be widespread.

The forecast models came from NCAR-Tropical Cyclone Guidance and National Hurricane Center, . Special thanks to all of them.

Irma Ravages Florida

Hurricane Irma made landfall made landfall on Cudjoe Key, Florida as a Category 4 hurricane with 929 millibars. It is moving north at 9 mph. Irma is a very large hurricane.

The Southeast Doppler mosaic has Irma engulfing a large portion of Florida. Many areas are getting heavy rain and strong winds. Hurricane force winds are up to 138 miles 221 km 120 nautical miles across from northwest to northeast quadrant and northeast to southeast quadrant. Tropical force winds are up to 437 miles 699 km 380 nautical miles across from northwest to northeast quadrant. Irma has gotten larger, which is a bad thing.

Hurricane force winds are felt in Southern Florida from Monroe, Miami-Dade, and Collier County. Many areas are reporting hurricane force winds. A crane had collapsed in Miami and storm surge is higher than forecasted. This is despite the fact that Irma is west of the area. This puts Miami over the dirty side. This leads to the next question, where does Irma go? Here is the forecast model of where Irma will go. This is the latest heat map from various forecast models and GFS ensemble track guidance for Irma. The GFS goes up to 10 days.

The first one I will show is for Florida. It has Irma going on the western wide of Florida. It could go over the Gulf of Mexico and west or east of Tampa Bay. Tampa Bay is one of the high risk area for storm surge due to its geography. Storm surge ravaging Tampa Bay would be worse than Katrina ravaging New Orleans and Mississippi or Sandy ravaging New York City area. You did not misread it. Tampa Bay is the worst for storm surge. Irma could go near Tampa Bay and this would be very bad.

The second one is where Irma goes once inland. There is a hot spot over Tennessee and Kentucky. This suggest that Irma may end up over that region. From there, it could east or northeast. Heavy rain will be the main problem inland depending on how fast Irma moves. The slower Irma moves, more chance for heavy rain.

Here is what I think will happen.
-Irma is going to ravage Florida.
-Storm surge and high waves will be a problem on the coast.
-Tampa Bay Area could get the brunt of Irma.

The forecast models came from NCAR-Tropical Cyclone Guidance, National Hurricane Center, , and National Weather Service. Special thanks to all of them.

Irma Getting Ever So Closer

Hurricane Irma is formidable Category 3 hurricane with 125 mph 200 km/h 109 knot winds. It has a central pressure of 933 millibars. It is moving slowly west at 9 mph. Irma should turn northward later tonight. South Florida and Florida Keys are feeling the affects of Irma.

There are feeder bands pelting South Florida with heavy rain and tropical storm force winds. Irma is a large hurricane despite weakening to Category 3.

Cuba is still experiencing hurricane force winds. Hurricane force winds are up to 138 miles 221 km 120 nautical miles across from northwest to northeast quadrant and northeast to southeast quadrant. Tropical force winds are up to 380 miles 608 km 330 nautical miles across from northwest to northeast quadrant. This makes Irma a large hurricane, which in itself is dangerous regardless of Category 3 or 5. Why large hurricanes are dangerous?

Storm surge is the problem. Larger hurricanes produce higher storm surge. Let me repeat these hurricanes that were large. Hurricane Katrina in 2005. Katrina made landfall as Category 3 on Louisiana and Mississippi. It produced storm surge as high as 35 feet/10.7 meters! By comparison, Hurricane Camille made landfall in 1969 in the same area as a Category 5 hurricane, but produced storm surge of 25 feet/7.6 meters. Camille was smaller than Katrina. Hurricane Ike is another example of a large hurricane, which made landfall on Texas as a Category 2 hurricane in 2008. Ike produce storm surge as high as 25 feet/7.6 meters, which is highest outside of Mississippi! Hurricane Sandy made landfall as a Category 1 hurricane on New Jersey in 2012. It produced storm surge as high as 15 feet/4.6 meters.

Many areas in Florida will see storm surge as high as 15 feet/4.6 meters. This type of storm surge is dangerous. The land will be inundated with 3 feet/0.9 meters or greater. That amount of water rushing in is dangerous and will wash anyone away! Anyone who lives in storm surge areas need to evacuate! If you live in an area with no storm surge, you should hide, with the exception living in a mobile home. Case in point, too many people evacuated when Hurricane Rita came barreling towards Texas and Louisiana. Most people who evacuated did not need to evacuate. This came a month after Katrina ravaged Louisiana and Mississippi. Also, more people died while evacuating than in the actual hurricane. We are seeing that problem with Florida. People who really need to evacuate are people who live in storm surge prone areas.

Here is the forecast model of where Irma will go. This is the latest heat map from various forecast models and GFS ensemble track guidance for Irma. The GFS goes up to 10 days.

Most have Irma going northwards towards Florida. It could go west of Florida or over Miami area. Either way, it is going to be bad for Florida. Once Irma is inland, most forecast models have Irma over Tennessee and Kentucky. This could be an issue as hurricanes weaken and go inland, they can dump heavy rain, especially at night. The heavy rains often fall at night near the center of the warm core low. These thunderstorms converge closer to the center at night as the low pressure system is warm core and the ambient temperature is cooler. They are called core rain. Hurricane Harvey is a tragic example of core rains that led to massive flooding in Southeast Texas including Houston. The forecast model is five days, so anything can change now and tomorrow.

Here is the most recent intensity forecast. The intensity forecast model for Irma are all over the place.

Some keep Irma as a Category 3 hurricane, while others have Irma intensifying into Category 4. I would not be surprised if Irma intensifies to Category 4 or even 5 prior to landfall on Florida. Regardless, Irma is going to be a very dangerous hurricane. A weakening hurricane can be more dangerous because people think if it weakens, than they should be safe. Hurricanes that weaken are due to land interaction or eyewall replacement cycle. Those two can cause hurricanes to get larger. Also, once eyewall replacement cycle is done, the hurricane gets larger and stronger.

The wind radii gets larger in part due to land interaction and eyewall replacement cycle as Irma gets closer to Florida. This is why I keep saying larger hurricanes are dangerous regardless of Category 3 or 5. Here is a rainfall forecast model ending at September 16, 2017 at 7:00 PM. They are from GFS, EURO, Canadian, and Weather Prediction Center (WPC).

All are in agreement that Florida will get heavy rain from Irma. GFS and WPC have the heavy rain over the middle of Florida. EURO has the heavy rain over the western part of Florida. The Canadian has heavy rain over eastern part of Florida. The GFS has the heaviest amount of up to 35.2 inches/89.4 centimeters of rain. It is south of the Florida Keys. The EURO has 17.9 inches/45.5 centimeters of rain, which is also south of the Florida Keys. Most areas should see 8 to 12 inches/20.3 to 30.5 centimeters of rain from Irma.

Here is what I think will happen.
-Irma could affect Florida as early as tomorrow morning.
-Storm surge and high waves will be a problem on the coast.
-Strong winds and heavy rain will be the main problem inland.

The forecast models came from NCAR-Tropical Cyclone Guidance, National Hurricane Center, Weather.US, Weather Prediction Center (WPC), and NWS Key West. Special thanks to all of them.

It is going to be a long night and day for Florida. Let’s hope everyone is hunkered down in areas that have no storm surge. Anyone who is storm surge prone areas are away. This could be bad for Florida.