An original post from 2018 that is reposted and changed.
It is hard to believe it has been 15 years since Hurricane Ike made landfall on Southeast Texas as a monsterous Category 2 hurricane in the early morning hours of September 13, 2008. Between the fifteen years a lot has happened since Ike. Before Ike came crashing in, Cyclone Nargis ravaged Burma (Myanmar) and claimed over 138,000 lives. Not too long after, there is the Sichuan Earthquake that claims nearly 88,000 lives. Ike made landfall seven years after the devastating 9/11 Terrorist Attacks, which destroyed the World Trade Center and claimed nearly 3,000 lives. Ike came three years after Hurricane Katrina, Rita, and Wilma ravaged the US Coast. Four years after the Indian Ocean Tsunami that ravaged Indonesia and Thailand.
After Ike, comes the collapse of Lehman Brothers during a severe recession. There is the deadly Haitian Earthquake that claims up to 316,000 lives and the Deep Horizon Oil Spill in 2010. Japan was hit by a deadly Tsunami that led to the Fukushima Nuclear Meltdown in 2011. Harvey came and flooded out Southeast Texas with heavy rain over a large area in 2017. Then comes COVID pandemic, which started in 2019, but did not get noticed until 2020. Ukraine and Sudan are currently mired in war.
Ike pelted Southeast Texas and Southwest Louisiana with hurricane force winds and heavy rain. Ike was the last hurricane to hit Texas prior to Harvey. Almost a nine year gap of no hurricanes hitting Texas, let alone a major hurricane. The last major hurricane to hit Texas prior to Harvey was Bret in 1999, which is 18 years.

What is the origin of Hurricane Ike? Ike started as a mesoscale convective system (MCS) that formed over Sudan on August 19th. Most tropical waves come from thunderstorms that form in the Northeast part of Africa. They are set off by the Intertropical Convergence Zone (ITCZ) or monsoon. The ITCZ is where there is thunderstorms from the clash of trade winds. These thunderstorms often provide beneficial rains in tropical and subtropical areas. The thunderstorms in ITCZ can break away and travel away. One of those thunderstorms from the ITCZ managed to do that. The MCS traveled over Africa and entered the Atlantic Ocean as a tropical wave on August 29th. The tropical wave traveled across with multiple vortices competing. One of them would win out as the thunderstorms in the tropical wave get better organized on September 1, 2008. It is upgraded to Tropical Depression #9. Later that day, it is named Ike as it travels over the open Atlantic. Tropical Storm Ike has to deal with wind shear in the upper level early in its life. The wind shear blows tops of thunderstorms, especially westerly wind shear. Since 2008 season is Neutral to La Nina, conditions are more favorable as there is less westerly wind shear. If 2008 was El Nino, there would be more westerly wind shear, which is why generally El Nino Atlantic Hurricane seasons see less storms. Wind shear generally kills tropical development. The higher the storm clouds are, the cooler it is. Higher storm clouds also mean they are more intense.
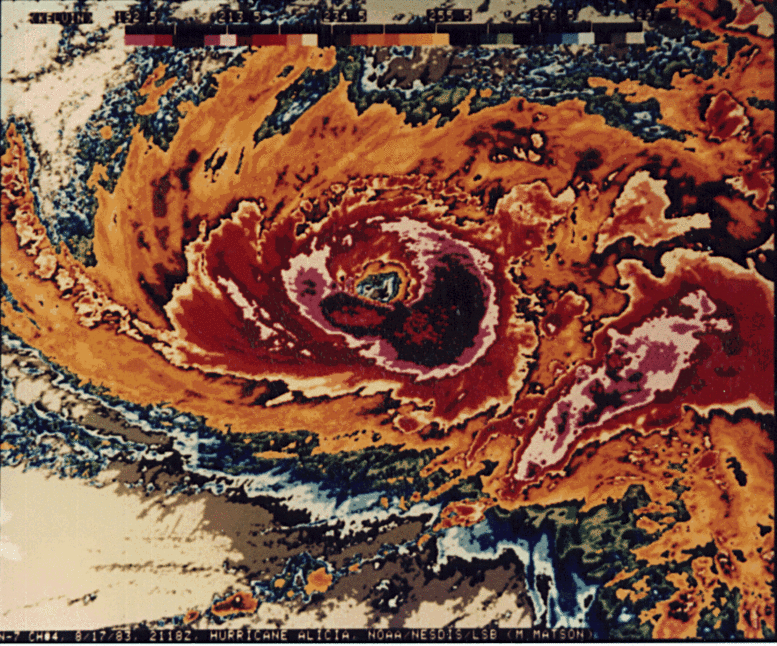
However, Ike gets a reprieve as the wind shear weakens and encounter warmer waters on September 3rd. This allows Ike to rapidly intensify into a major hurricane. By the next day, Ike becomes 2008’s strongest hurricane with 145 mph 126 knots 233 km/h winds and central pressure of 935 millibars. Ike’s strength did not last as it encountered wind shear on September 5th. The wind shear weaken Ike to Category 2 strength.

Ike is pushed southwards into more favorable areas due to upper level ridge to the north. Ike becomes a Category 4 hurricane as conditions are more favorable. As it goes westward, Ike made its first landfall on Turks and Caicos Islands as a Category 4 hurricane on the early morning hours of September 7th. The Turks and Caicos Islands are the first to feel Ike’s violent wrath in the form of strong winds, heavy rain, storm surge, and high waves. The South Caicos and Grand Turk take the brunt of Ike. Despite Ike’s fury, there are no reports of fatalities.

While Ike is ravaging the Turks and Caicos Islands, the outer bands of Ike are dumping heavy rain on Haiti and Dominican Republic, which have been ravaged by Fay, Gustav, and Hanna. The flooding from Ike claims 74 lives in Haiti and 2 in Dominican Republic. Prior to Ike, Tropical Storm Hanna ravaged Haiti and Dominican Republic with heavy rain that led to massive flooding. The flooding claims 529 lives in Haiti, while just one dies in Dominican Republic. Why did Haiti see more fatalities than Dominican Republic? The lack of trees in Haiti makes it even more vulnerable to mudslides from the mountains. The heavy rain causes deadly mudslides that destroys houses and kill people.

Once Ike passes Turks and Caicos Island, Ike heads for Cuba. The hurricane makes landfall on Cabo Lucrecia, Holguín Province, Cuba. Cuba is in a very rough ride with Ike as it traverses over the entire island nation. Cuba is being pelted by heavy rain, strong wind, high waves, and storm surge. Briefly, Ike goes over the water only to make a second landfall on Punta La Capitana, Pinar del Río, Cuba on September 8th as a Category 1 hurricane. Ike claims 7 lives in Cuba.

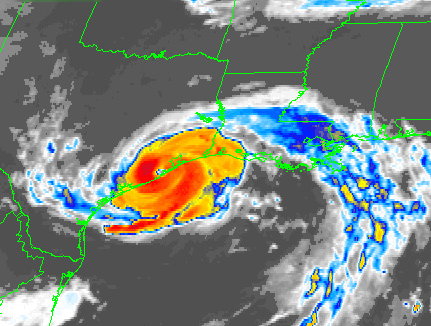
Once Ike exits Cuba, it is a large Category 1 hurricane. Ike traveling over all of Cuba caused the storm to expand as energy is spread out from land interaction. It also disrupted Ike’s core. Ike enters large area of warm water in the Gulf of Mexico and is getting close to the Loop Current, which is one of the warmest spot. Ike rapidly deepen from 963 to 944 millibars on the night of September 10th as it was over the Loop Current. However, the wind did not strengthen much, only from 80 to 100 mph 70 knots to 87 knots 128 km/h to 161 km/h. The reason is Ike is a very large hurricane with hurricane force winds extending up to 125 miles 109 nautical miles 201 kilometers from the eye. The pressure gradient is not tight due to its large size. Normally, an Atlantic hurricane with central pressure of 944 millibars is a Category 3 or 4 hurricane.
On September 11th, as America remembers and reflects the seventh anniversary of the 9/11 Terrorist Attacks, Southeast Texas is sunny and dry. The west side of a hurricane in the Northern Hemisphere is usually the “clean” side. It blows in dry and sinking air from the north. The nice sunny day is very deceptive as Ike is ever inching closer. Meanwhile in the Gulf of Mexico, Ike is generating massive waves that are heading towards the Texas and Louisiana. Ike continues across the Gulf of Mexico as a large Category 2 hurricane. Waves are coming ahead of Ike in coastal Texas. People are evacuating from coastal areas including Galveston. Some choose to stay behind. The outer cloud banks of Ike are over Southeast Texas as winds start to pick up. By the afternoon of September 12th, some coastal areas are getting squally weather from the feeder bands entering Texas.
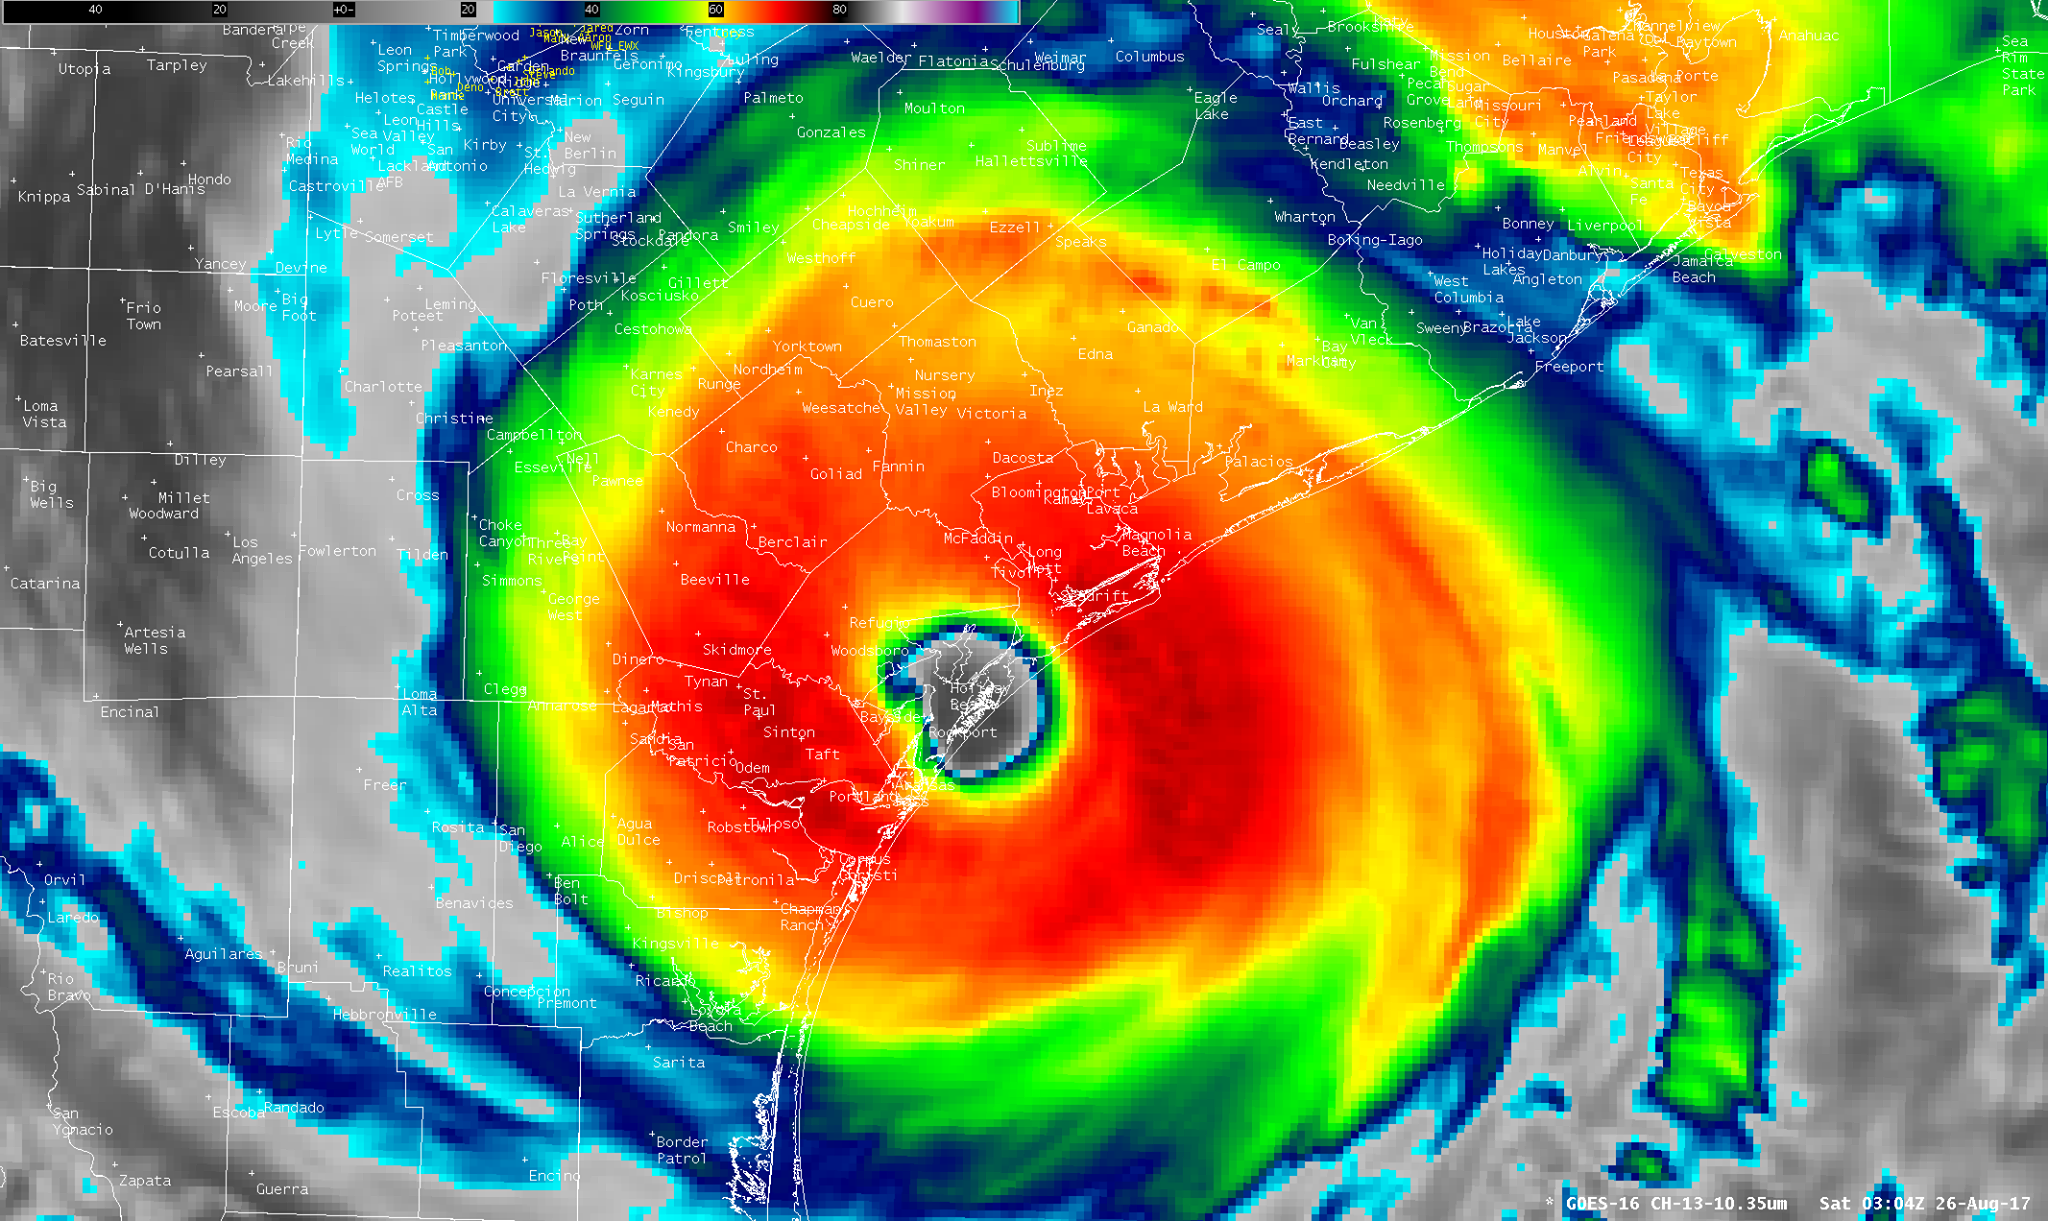
By the night of September 12th, conditions have gotten much worse. Meanwhile in Houston area, it is still windy with occasionally light rain. As the night progresses, Ike is getting closer to landfall. The hurricane force winds enter Texas around the late hours of September 12th. Ike is getting stronger and developing a more organized eyewall. Ike now has a central pressure of 951 millibars and 110 mph 96 knots 177 km/h winds. Ike is a large hurricane with hurricane force winds extending up to 125 miles and tropical storm force winds extending up to 260 miles 226 nautical miles 418 kilometers.


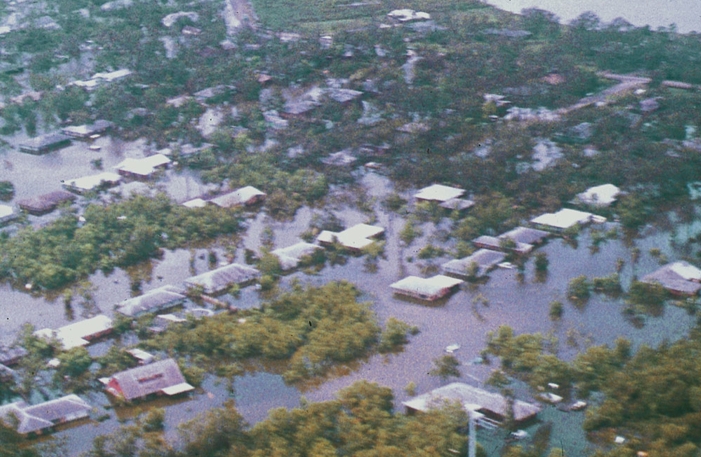
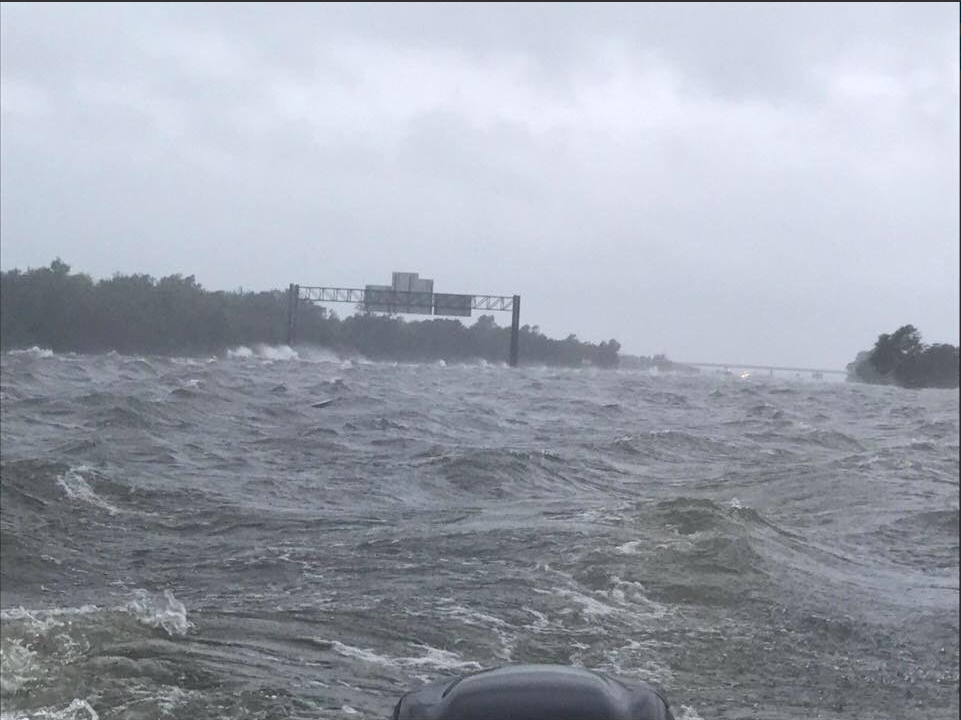
By the early morning hours of September 13th, Houston area is seeing stronger winds and heavier rain. Power starts to go out throughout Southeast Texas as power lines are being knocked by the strong wind. The coastal areas are seeing storm surge getting higher and higher. Anyone who stayed behind in Galveston or Bolivar Peninsula are doomed by the massive storm surge. Ike makes landfall on the eastern end of Galveston Island at 2:10 AM Central Time. People who are staying behind in the coastal areas are wishing they had evacuated as they are surrounded by rising storm surge. Ike travels to the northwest towards Houston. By 4:00 AM, Ike is over Baytown, which is flooded by storm surge. A large area of Southeast Texas is getting hurricane force winds including all of Houston.


By the time the Sun rises, Ike is still ravaging Southeast Texas despite the fact it has weakened to Category 1 hurricane. Ike remains a monsterous and very dangerous hurricane. Many areas are still seeing heavy rain and strong winds. The wind blow down numerous trees and damage many buildings and houses. There is widespread flooding reported throughout Southeast Texas. Bayous and rivers are overflowing from widespread heavy rain. Coastal areas had storm surge as high as 25 feet/7.6 meters. It is one of the highest storm surge recorded in America and highest in Texas. It exceeds Camille, but below Katrina. Bolivar Peninsula saw the highest storm surge as the whole area looked like if a nuclear bomb had exploded. Once it is all over, many buildings and houses are damaged or destroyed, while many trees are uprooted. Coastal areas are utterly gutted from the massive storm surge. Millions of people are out of power for days. A large area saw 6 to 12 inches/15.2 to 30.5 centimeters of rain from Ike.
The damage is not just limited to Texas. Louisiana also felt the brunt of Ike, especially in Southwestern Louisiana. It is the same area that had been ravaged by Hurricane Rita in 2005. Many areas are flooded by Ike. There is even flooding in New Iberia, which is in Central Louisiana. It shows that Ike’s massive size had a huge impact over a large area from Texas to Louisiana. This is despite the fact that they only got tropical storm force winds. It shows that large, but not so strong hurricane is very dangerous as it produces massive storm surge and high waves.

The following night, a cold front passes, which allows thunderstorms to form from moisture left by Ike. The storms dumped 5 to 8 inches/12.7 to 20.3 centimeters of rain. The heavy rain causes more flooding on top of what Ike dumped in Southeast Texas. Once the rain ended, many areas saw a two day total ranging from 10 to 20 inches/25.4 to 50.8 centimeters of rain. Meanwhile, the remnants of Ike continue to wreak havoc in the Midwest. Ohio see hurricane force gusts, which causes more power outages. The remains of Ike continue into Canada and dump heavy rain in Ontario and Quebec. A total of 112 people lost their life with 34 unaccounted for in America. Most of the deaths are in Texas, where 84 people died.

So, how was 2008 like prior to Ike. The winter of 2007-2008 is La Nina, so it is warmer and drier. Despite the La Nina, there are storms. Spring of 2008 is mostly dry. There were days of pleasant weather in Spring 2008. Summer of 2008 is average in terms of temperature and rainfall. Texas first brush with a hurricane is Dolly, which affected South Texas. The outer bands of Dolly dump heavy rain in the Houston area. Not too long after Dolly came, Tropical Storm Edouard pays a visit to Houston area. It is a rather unremarkable tropical storm that dumps up to 6 inches of rain. Edouard moves inland and gives beneficial rains to drought ridden Central Texas.
NHC Hurricane Ike Report
NHC Hurricane Ike Advisory Report
Morphed Integrated Microwave Imagery at CIMSS (MIMIC)