April 2024 Hurricane Season Forecast

2024 has proven to be a turbulent year. Israel, Sudan, and Ukraine are engulfed in war. The 2020s have been a turbulent decade so far. Hurricane Season is coming as it starts on June 1, 2024. Here are other forecasts. ACE is short for Accumulated Cyclone Energy.

Colorado State University
23/11/5 ACE: 210

Joe Bastardi (Weather Bell)
25-30 Tropical Storms/14-16 Hurricanes/6-8 Major Hurricanes ACE: 200-240

Tropical Storm Risk
20/9/4 ACE: 160

Accuweather
20-25 Tropical Storms/8-12 Hurricanes/4-7 Major Hurricanes ACE: 175-225

Crown Weather
25/12/6 ACE: 225

The Weather Channel
24/11/6

Weather Tiger
20-24 Tropical Storms/9-12 Hurricanes/4-7 Major Hurricanes ACE: 160-225

University of Arizona
21/11/5 ACE: 156

North Carolina University
15-20 Tropical Storms/10-12 Hurricanes/3-4 Major Hurricanes

The analog years I am using are in which El Nino is fading away and going into La Nina. Obviously, the forecast is uncertain. In this case, I am more looking at Eastern Equatorial El Nino. I also take into account El Nino Modoki. The warmest water is in the Central to Western Pacific.

El Nino is not the only factor. I look at Atlantic Multidecadal Oscillation (AMO), Pacific Decadal Oscillation (PDO), Northeast Pacific Warm Pool (NEPWP), Equatorial Indian Ocean (EIO), Tropical South Atlantic (TSAI), New Zealand Warm Pool (NZWP), Quasi-Biennial Oscillation (QBO), Atlantic Main Development Region (MDR), Dipole Mode Index (DMI), and Tripole Index for the Interdecadal Pacific Oscillation (TPI IPO). Here is the ocean temperature anomaly map. It is from Tropical Tidbits.
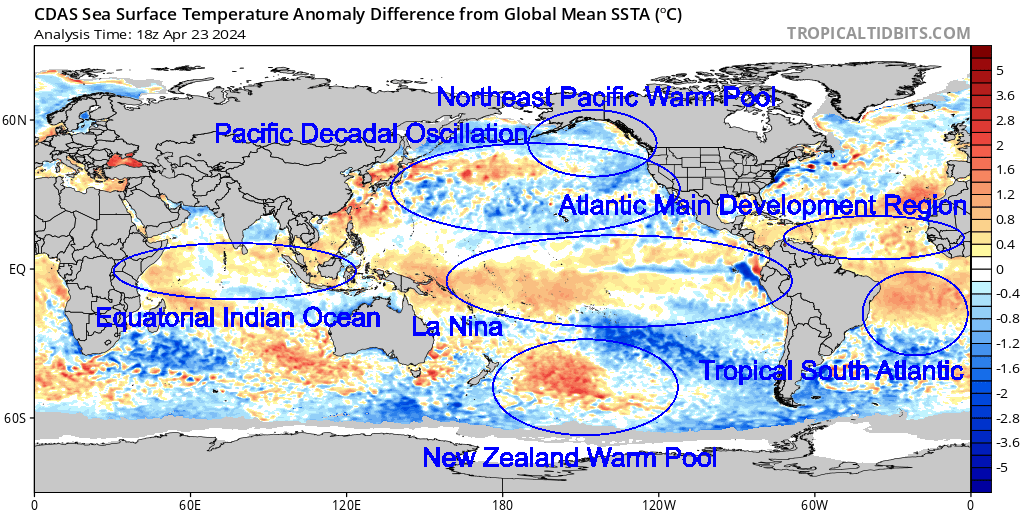
Based on this, the analog years are 1897, 1926, 1931, 1958, 1977, 1983, 1995, 1998, 2005, 2007, 2010, 2016, and 2020

Analog Years For 2024 (TS/H/MH ACE ACE/Storm)
1897 (6/3/0 55 9.1)
1926 (11/8/6 230 20.9)
1931 (13/3/1 48 3.7)
1958 (12/7/3 110 9.1)
1977 (6/5/1 25 4.2)
1983 (4/3/1 17 4.4)
1995 (19/11/5 227 12.0)
1998 (14/10/3 182 13.0)
2005 (28/15/7 245 8.8)
2007 (15/6/2 74 4.9)
2010 (19/12/5 166 8.7)
2016 (15/7/4 141 9.4)
2020 (30/13/6 180 6.0)

All of the seasons had major hurricane with the exception of 1897. However, this is before satellite era. It is likely before satellites, the seasons were more active than what is recorded. Any season before satellite should be considered suspect. Even in satellite era, some data is rather questionable. The most active are 2005 and 2020. In terms of Accumulated Cyclone Energy (ACE), that goes to 2005 with ACE of 245. 1926 and 1995 are not far behind.

Here are notable storms in the analog seasons.
1897
Hurricane #1
Hurricane #2
Hurricane #5

1926
1926 Nassau Hurricane
Great Miami Hurricane Of 1926
Great Havana-Bermuda Hurricane Of 1926

1931
Tropical Storm #5
1931 British Honduras Hurricane

1958
Alma
Ella
Helene

1977
Anita

1983
Alicia

1995
Dean
Erin
Luis
Marilyn
Opal
Roxanne

1998
Charley
Earl
Francis
Georges
Mitch

2005
Dennis
Emily
Katrina
Rita
Stan
Vince
Wilma
Alpha
Beta
Gamma
Delta

2007
Dean
Erin
Felix
Humberto
Noel

2010
Alex
Hermine
Igor
Karl
Matthew
Nicole

2016
Earl
Matthew
Nicole
Otto

2020
Hanna
Laura
Sally
Teddy
Alpha
Beta
Delta
Zeta
Eta
Iota

The analog season have some memorable and deadly storms. Hurricane Mitch in 1998 dumped heavy rain over a large area of Central America. It led to massive flooding that claimed at least 12,000 lives. Mitch is the deadliest since the Great Hurricane of 1780. 1926 has the Great Miami Hurricane of 1926. It would likely be the costliest if it happened today. 1931 had the British Honduras Hurricane, which claimed over 2,500 lives. 1958 had Alma and Ella impact Texas with heavy rain and flooding. 1977 had Anita, which was a powerful Category 5 hurricane in the Gulf Of Mexico. Alicia ravaged Southeast Texas inn 1983. 1977 and 1983 were less active seasons. 1995 was an active season with Luis, Marilyn, Opal, and Roxanne. Besides Mitch, there was Georges, which was a long lived and dangerous hurricane. Charley and Francis dumped heavy rain on Texas. 2005 was a brutal year. It can be summed up with Katrina, Rita, Stan, and Wilma. New Orleans was flooded from levee failure, while Mississippi was utterly gutted by monster storm surge. Rita caused a scare in Texas before making landfall on Sabine Pass. Stan dumped heavy rain and flooding in Guatemala and Mexico. Wilma rapidly intensified into the most intense Atlantic hurricane known. Dean and Felix ravaged the Caribbean. Noel proved to be a disaster for Dominican Republic and Haiti. Texas had to contend with Erin and Humberto. Humberto formed quickly right before landfall a year to the day before Ike made landfall in 2008. 2010 had many storms form. Alex was a large storm that dumped heavy rain over Mexico and Texas. Igor was a monster hurricane that tracked across the Atlantic. 2016 had Matthew ravaged Haiti, Florida, and North Carolina with strong winds, heavy rain, and flooding. 2020 was active during the COVID pandemic. Laura and Delta ravaged Southwest Louisiana within weeks of each other. Zeta went over New Orleans as a Category 1 hurricane. Eta and Iota were cruel to Nicaragua. They made landfall weeks apart of each other. I am not suggesting 2024 will see another Great Miami Hurricane of 1926, 1931 British Honduras Hurricane, Alicia, Opal, Mitch, Katrina, Wilma, Dean, Alex, Matthew, Laura, or Iota.

Here is a heat map of analog seasons. It is based on 300 mile radius from the storms. It was created with QGIS. The hurricane data came from International Best Track Archive for Climate Stewardship (IBTrACS).
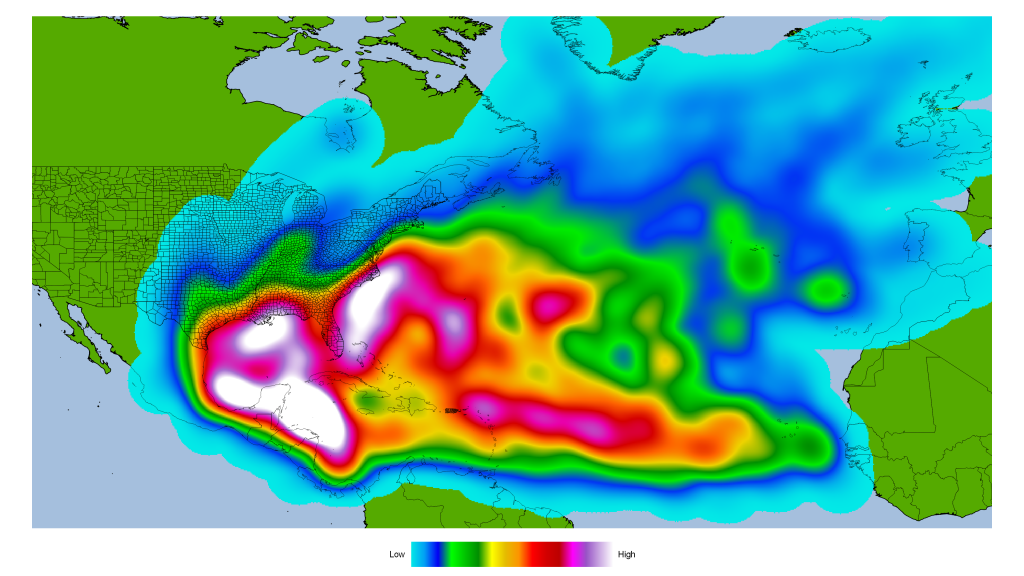
The Caribbean, Gulf Of Mexico, and Carolina Coasts look to have the most development. I never make landfall predictions. I strongly object to making landfall forecasts this early. I think it is irresponsible to make landfall predictions this early on. Everyone is at equal risk.

Here is a statistical analysis of analog seasons vs all season (1870-2023). It was done with PSPP.

Analog

Tropical StormMean14.77
95% Confidence Interval for MeanLower Bound10.03
Upper Bound19.51
5% Trimmed Mean14.52
Median14
Variance61.53
Std. Deviation7.84
Minimum4
Maximum30
Range26
Interquartile Range10.5
Skewness0.68
Kurtosis0.1
HurricaneMean7.92
95% Confidence Interval for MeanLower Bound5.5
Upper Bound10.35
5% Trimmed Mean7.8
Median7
Variance16.08
Std. Deviation4.01
Minimum3
Maximum15
Range12
Interquartile Range7.5
Skewness0.3
Kurtosis-1.04
Major HurricaneMean3.38
95% Confidence Interval for MeanLower Bound2
Upper Bound4.77
5% Trimmed Mean3.37
Median3
Variance5.26
Std. Deviation2.29
Minimum0
Maximum7
Range7
Interquartile Range4.5
Skewness0.08
Kurtosis-1.38
ACEMean130.69
95% Confidence Interval for MeanLower Bound81.71
Upper Bound179.68
5% Trimmed Mean130.62
Median141.3
Variance6570.41
Std. Deviation81.06
Minimum17.4
Maximum245.3
Range227.9
Interquartile Range153.3
Skewness-0.03
Kurtosis-1.54
ACE/StormMean8.78
95% Confidence Interval for MeanLower Bound5.94
Upper Bound11.61
5% Trimmed Mean8.39
Median8.76
Variance21.98
Std. Deviation4.69
Minimum3.68
Maximum20.87
Range17.2
Interquartile Range6.05
Skewness1.42
Kurtosis2.81

How do analog seasons compare as a whole. Statistics from 1870 to 2023.

Tropical StormMean10.41
95% Confidence Interval for MeanLower Bound9.67
Upper Bound11.15
5% Trimmed Mean10.14
Median10
Variance21.76
Std. Deviation4.66
Minimum1
Maximum30
Range29
Interquartile Range6
Skewness1.05
Kurtosis2.09
HurricaneMean5.66
95% Confidence Interval for MeanLower Bound5.24
Upper Bound6.09
5% Trimmed Mean5.55
Median5
Variance7.06
Std. Deviation2.66
Minimum0
Maximum15
Range15
Interquartile Range3
Skewness0.69
Kurtosis0.54
Major HurricaneMean2.08
95% Confidence Interval for MeanLower Bound1.82
Upper Bound2.34
5% Trimmed Mean1.97
Median2
Variance2.71
Std. Deviation1.65
Minimum0
Maximum7
Range7
Interquartile Range2
Skewness0.86
Kurtosis0.24
ACEMean94.82
95% Confidence Interval for MeanLower Bound86.25
Upper Bound103.39
5% Trimmed Mean91.46
Median84.25
Variance2897.5
Std. Deviation53.83
Minimum2.5
Maximum258.6
Range256.1
Interquartile Range74.22
Skewness0.88
Kurtosis0.37
ACE/StormMean9.2
95% Confidence Interval for MeanLower Bound8.58
Upper Bound9.82
5% Trimmed Mean9
Median8.6
Variance15.13
Std. Deviation3.89
Minimum1.83
Maximum21.68
Range19.86
Interquartile Range5.58
Skewness0.8
Kurtosis0.56

The 95% Confidence Interval for analog season vs the whole season is wide. Analog seasons are more active. It is largely due to many of the analog years being very active. I can use the statistical analysis to come up with a forecast.

What is my prediction for this season?
20 to 30 named storms, likely 25 named storms
10 to 16 hurricanes, likely 13 hurricanes
3 to 7 major hurricanes with 5 major hurricanes
ACE is 180 to 250 with ACE likely of 190 to 230

Let’s see how my April 2023 hurricane forecast compare to the actual 2023 season.

10 to 15 named storms, likely 12 named storms
3 to 6 hurricanes, likely 5 hurricanes
1 to 3 major hurricanes with 2 major hurricanes
ACE is 70 to 140 with ACE likely of 80 to 100

Colorado State University
13/6/2 ACE: 100

Joe Bastardi (Weather Bell)
10-14 Storms/5-7 Hurricanes/2-3 Major Hurricanes ACE: 70-110

Tropical Storm Risk
12/6/2 ACE: 84

Accuweather
11-15 Storms/4-8 Hurricanes/1-3 Major Hurricanes ACE: 75-105

Crown Weather
12/6/2 ACE: 90

The Weather Channel
15/7/3

Weather Tiger
13-18 Tropical Storms/5-8 Hurricanes/2-3 Major Hurricanes ACE: 65-135

University of Arizona
19/9/5 ACE: 163

North Carolina University
11-15 Storms/6-8 Hurricanes/2-3 Major Hurricanes

2023 Actual Number
20 Named Storms
7 Hurricanes
3 Major Hurricanes
146 ACE

Many including myself got the forecast off. The 2023 Hurricane Season was more active than forecasted. Even with a strong El Nino, 2023 was quite an active season. It shows, El Nino is not the only factor. The Atlantic water was quite warm in 2023.

Regardless of forecast, I think 2024 could be an interesting hurricane season. It could be a harry one as I have said in the past. It only takes one to be a devastating season regardless of how inactive or active a season is. I would not be surprised if 2024 is an active season. I predict we could see 2 to 4 Category 5 hurricanes this season.

Hurricane Ike 15 Years Later

An original post from 2018 that is reposted and changed.

It is hard to believe it has been 15 years since Hurricane Ike made landfall on Southeast Texas as a monsterous Category 2 hurricane in the early morning hours of September 13, 2008. Between the fifteen years a lot has happened since Ike. Before Ike came crashing in, Cyclone Nargis ravaged Burma (Myanmar) and claimed over 138,000 lives. Not too long after, there is the Sichuan Earthquake that claims nearly 88,000 lives. Ike made landfall seven years after the devastating 9/11 Terrorist Attacks, which destroyed the World Trade Center and claimed nearly 3,000 lives. Ike came three years after Hurricane Katrina, Rita, and Wilma ravaged the US Coast. Four years after the Indian Ocean Tsunami that ravaged Indonesia and Thailand.

After Ike, comes the collapse of Lehman Brothers during a severe recession. There is the deadly Haitian Earthquake that claims up to 316,000 lives and the Deep Horizon Oil Spill in 2010. Japan was hit by a deadly Tsunami that led to the Fukushima Nuclear Meltdown in 2011. Harvey came and flooded out Southeast Texas with heavy rain over a large area in 2017. Then comes COVID pandemic, which started in 2019, but did not get noticed until 2020. Ukraine and Sudan are currently mired in war.

Ike pelted Southeast Texas and Southwest Louisiana with hurricane force winds and heavy rain. Ike was the last hurricane to hit Texas prior to Harvey. Almost a nine year gap of no hurricanes hitting Texas, let alone a major hurricane. The last major hurricane to hit Texas prior to Harvey was Bret in 1999, which is 18 years.

Thunderstorms over Sudan that later became Ike.

What is the origin of Hurricane Ike? Ike started as a mesoscale convective system (MCS) that formed over Sudan on August 19th. Most tropical waves come from thunderstorms that form in the Northeast part of Africa. They are set off by the Intertropical Convergence Zone (ITCZ) or monsoon. The ITCZ is where there is thunderstorms from the clash of trade winds. These thunderstorms often provide beneficial rains in tropical and subtropical areas. The thunderstorms in ITCZ can break away and travel away. One of those thunderstorms from the ITCZ managed to do that. The MCS traveled over Africa and entered the Atlantic Ocean as a tropical wave on August 29th. The tropical wave traveled across with multiple vortices competing. One of them would win out as the thunderstorms in the tropical wave get better organized on September 1, 2008. It is upgraded to Tropical Depression #9. Later that day, it is named Ike as it travels over the open Atlantic. Tropical Storm Ike has to deal with wind shear in the upper level early in its life. The wind shear blows tops of thunderstorms, especially westerly wind shear. Since 2008 season is Neutral to La Nina, conditions are more favorable as there is less westerly wind shear. If 2008 was El Nino, there would be more westerly wind shear, which is why generally El Nino Atlantic Hurricane seasons see less storms. Wind shear generally kills tropical development. The higher the storm clouds are, the cooler it is. Higher storm clouds also mean they are more intense.

However, Ike gets a reprieve as the wind shear weakens and encounter warmer waters on September 3rd. This allows Ike to rapidly intensify into a major hurricane. By the next day, Ike becomes 2008’s strongest hurricane with 145 mph 126 knots 233 km/h winds and central pressure of 935 millibars. Ike’s strength did not last as it encountered wind shear on September 5th. The wind shear weaken Ike to Category 2 strength.

Hurricane Ike around its peak.

Ike is pushed southwards into more favorable areas due to upper level ridge to the north. Ike becomes a Category 4 hurricane as conditions are more favorable. As it goes westward, Ike made its first landfall on Turks and Caicos Islands as a Category 4 hurricane on the early morning hours of September 7th. The Turks and Caicos Islands are the first to feel Ike’s violent wrath in the form of strong winds, heavy rain, storm surge, and high waves. The South Caicos and Grand Turk take the brunt of Ike. Despite Ike’s fury, there are no reports of fatalities.

Damage in Grand Turk.

While Ike is ravaging the Turks and Caicos Islands, the outer bands of Ike are dumping heavy rain on Haiti and Dominican Republic, which have been ravaged by Fay, Gustav, and Hanna. The flooding from Ike claims 74 lives in Haiti and 2 in Dominican Republic. Prior to Ike, Tropical Storm Hanna ravaged Haiti and Dominican Republic with heavy rain that led to massive flooding. The flooding claims 529 lives in Haiti, while just one dies in Dominican Republic. Why did Haiti see more fatalities than Dominican Republic? The lack of trees in Haiti makes it even more vulnerable to mudslides from the mountains. The heavy rain causes deadly mudslides that destroys houses and kill people.

Stranded Cubans following Ike.

Once Ike passes Turks and Caicos Island, Ike heads for Cuba. The hurricane makes landfall on Cabo Lucrecia, Holguín Province, Cuba. Cuba is in a very rough ride with Ike as it traverses over the entire island nation. Cuba is being pelted by heavy rain, strong wind, high waves, and storm surge. Briefly, Ike goes over the water only to make a second landfall on Punta La Capitana, Pinar del Río, Cuba on September 8th as a Category 1 hurricane. Ike claims 7 lives in Cuba.

Ike near its secondary peak in Gulf of Mexico.

Once Ike exits Cuba, it is a large Category 1 hurricane. Ike traveling over all of Cuba caused the storm to expand as energy is spread out from land interaction. It also disrupted Ike’s core. Ike enters large area of warm water in the Gulf of Mexico and is getting close to the Loop Current, which is one of the warmest spot. Ike rapidly deepen from 963 to 944 millibars on the night of September 10th as it was over the Loop Current. However, the wind did not strengthen much, only from 80 to 100 mph 70 knots to 87 knots 128 km/h to 161 km/h. The reason is Ike is a very large hurricane with hurricane force winds extending up to 125 miles 109 nautical miles 201 kilometers from the eye. The pressure gradient is not tight due to its large size. Normally, an Atlantic hurricane with central pressure of 944 millibars is a Category 3 or 4 hurricane.

On September 11th, as America remembers and reflects the seventh anniversary of the 9/11 Terrorist Attacks, Southeast Texas is sunny and dry. The west side of a hurricane in the Northern Hemisphere is usually the “clean” side. It blows in dry and sinking air from the north. The nice sunny day is very deceptive as Ike is ever inching closer. Meanwhile in the Gulf of Mexico, Ike is generating massive waves that are heading towards the Texas and Louisiana. Ike continues across the Gulf of Mexico as a large Category 2 hurricane. Waves are coming ahead of Ike in coastal Texas. People are evacuating from coastal areas including Galveston. Some choose to stay behind. The outer cloud banks of Ike are over Southeast Texas as winds start to pick up. By the afternoon of September 12th, some coastal areas are getting squally weather from the feeder bands entering Texas.

By the night of September 12th, conditions have gotten much worse. Meanwhile in Houston area, it is still windy with occasionally light rain. As the night progresses, Ike is getting closer to landfall. The hurricane force winds enter Texas around the late hours of September 12th. Ike is getting stronger and developing a more organized eyewall. Ike now has a central pressure of 951 millibars and 110 mph 96 knots 177 km/h winds. Ike is a large hurricane with hurricane force winds extending up to 125 miles and tropical storm force winds extending up to 260 miles 226 nautical miles 418 kilometers.

Ike at landfall on Southeast Texas.
Highest wind gust possible based on multiplying by factor of 1.5.

By the early morning hours of September 13th, Houston area is seeing stronger winds and heavier rain. Power starts to go out throughout Southeast Texas as power lines are being knocked by the strong wind. The coastal areas are seeing storm surge getting higher and higher. Anyone who stayed behind in Galveston or Bolivar Peninsula are doomed by the massive storm surge. Ike makes landfall on the eastern end of Galveston Island at 2:10 AM Central Time. People who are staying behind in the coastal areas are wishing they had evacuated as they are surrounded by rising storm surge. Ike travels to the northwest towards Houston. By 4:00 AM, Ike is over Baytown, which is flooded by storm surge. A large area of Southeast Texas is getting hurricane force winds including all of Houston.

Highest sustained winds during Hurricane Ike.
Bolivar Peninsula following Ike.

By the time the Sun rises, Ike is still ravaging Southeast Texas despite the fact it has weakened to Category 1 hurricane. Ike remains a monsterous and very dangerous hurricane. Many areas are still seeing heavy rain and strong winds. The wind blow down numerous trees and damage many buildings and houses. There is widespread flooding reported throughout Southeast Texas. Bayous and rivers are overflowing from widespread heavy rain. Coastal areas had storm surge as high as 25 feet/7.6 meters. It is one of the highest storm surge recorded in America and highest in Texas. It exceeds Camille, but below Katrina. Bolivar Peninsula saw the highest storm surge as the whole area looked like if a nuclear bomb had exploded. Once it is all over, many buildings and houses are damaged or destroyed, while many trees are uprooted. Coastal areas are utterly gutted from the massive storm surge. Millions of people are out of power for days. A large area saw 6 to 12 inches/15.2 to 30.5 centimeters of rain from Ike.

The damage is not just limited to Texas. Louisiana also felt the brunt of Ike, especially in Southwestern Louisiana. It is the same area that had been ravaged by Hurricane Rita in 2005. Many areas are flooded by Ike. There is even flooding in New Iberia, which is in Central Louisiana. It shows that Ike’s massive size had a huge impact over a large area from Texas to Louisiana. This is despite the fact that they only got tropical storm force winds. It shows that large, but not so strong hurricane is very dangerous as it produces massive storm surge and high waves.

Thunderstorms ahead of a cold front in the early morning hours of September 14, 2008.

The following night, a cold front passes, which allows thunderstorms to form from moisture left by Ike. The storms dumped 5 to 8 inches/12.7 to 20.3 centimeters of rain. The heavy rain causes more flooding on top of what Ike dumped in Southeast Texas. Once the rain ended, many areas saw a two day total ranging from 10 to 20 inches/25.4 to 50.8 centimeters of rain. Meanwhile, the remnants of Ike continue to wreak havoc in the Midwest. Ohio see hurricane force gusts, which causes more power outages. The remains of Ike continue into Canada and dump heavy rain in Ontario and Quebec. A total of 112 people lost their life with 34 unaccounted for in America. Most of the deaths are in Texas, where 84 people died.

Rainfall total from September 12, 2008 to September 15, 2008.

So, how was 2008 like prior to Ike. The winter of 2007-2008 is La Nina, so it is warmer and drier. Despite the La Nina, there are storms. Spring of 2008 is mostly dry. There were days of pleasant weather in Spring 2008. Summer of 2008 is average in terms of temperature and rainfall. Texas first brush with a hurricane is Dolly, which affected South Texas. The outer bands of Dolly dump heavy rain in the Houston area. Not too long after Dolly came, Tropical Storm Edouard pays a visit to Houston area. It is a rather unremarkable tropical storm that dumps up to 6 inches of rain. Edouard moves inland and gives beneficial rains to drought ridden Central Texas.

NHC Hurricane Ike Report
NHC Hurricane Ike Advisory Report
Morphed Integrated Microwave Imagery at CIMSS (MIMIC)

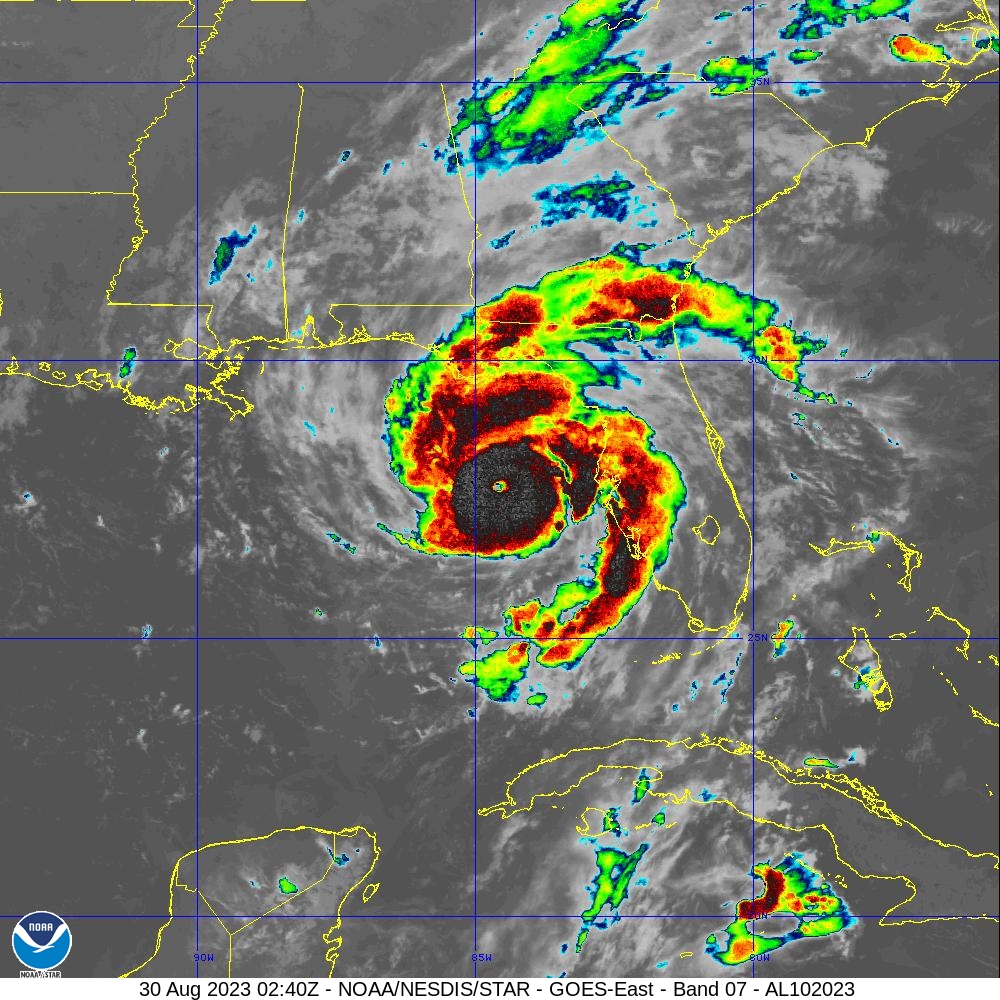
Intensifying Idalia

Hurricane Idalia over the Gulf of Mexico.
https://www.star.nesdis.noaa.gov/GOES/floater.php?stormid=AL102023#tab2

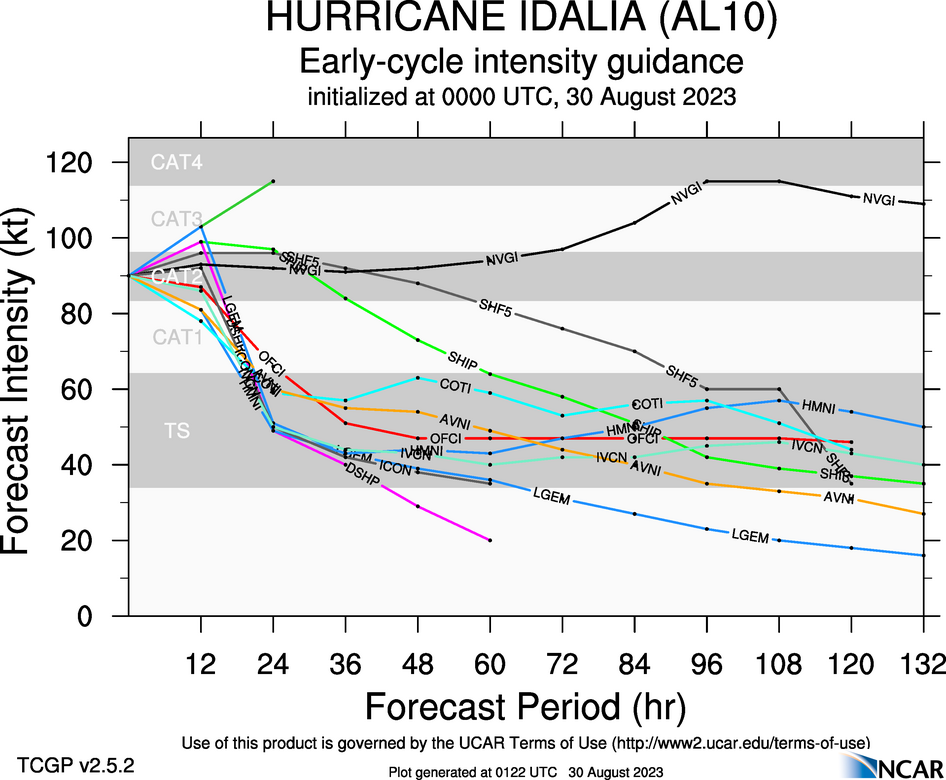
Hurricane Franklin is the first major hurricane of the 2023 Atlantic Season. It is a Category 3 hurricane with 115 mph winds as of 11:00 PM AST per National Hurricane Center (NHC). It peaked as a Category 4 hurricane. However, it is over the open Atlantic and poses little threat at this time. Right now, my main concern is Hurricane Idalia. It is a Category 2 hurricane with 110 mph winds as of 11:00 PM EDT. However, looking at satellite images, there is a tiny eye and circular shape suggests it is likely intensifying. Here is the intensity forecast model from National Center for Atmospheric Research (NCAR).
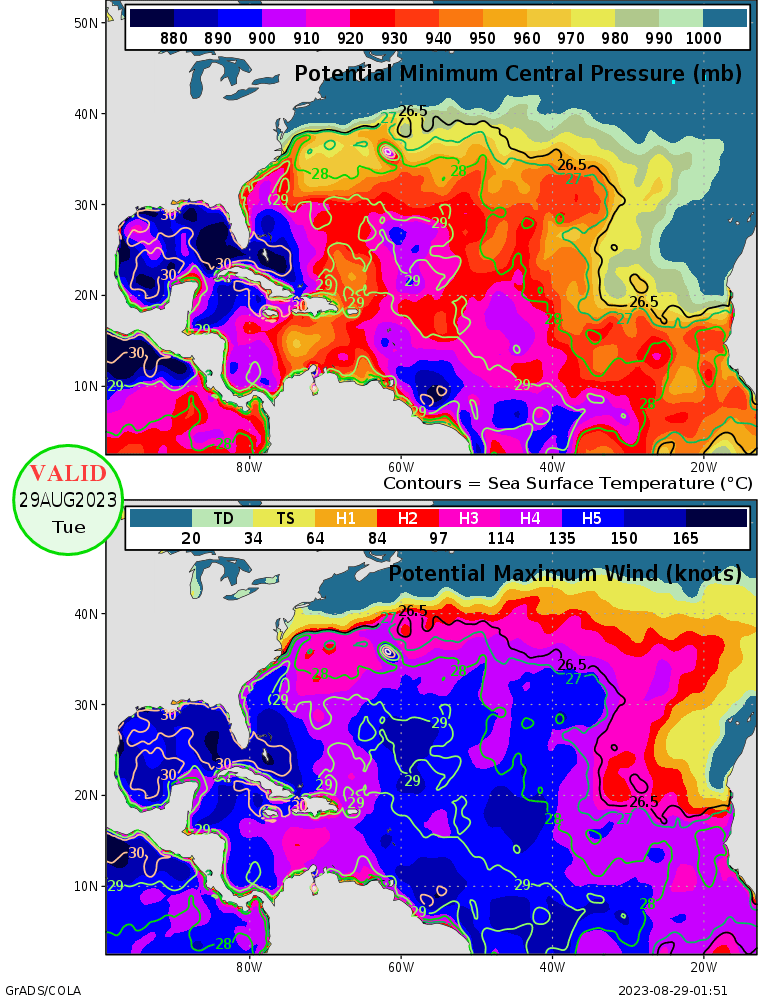
Most forecast models have Idalia as a Category 3 hurricane with one as a Category 4 hurricane. I consider intensity forecast models unreliable. I think Idalia is going to be a Category 4 hurricane by morning. It may even be a Category 5 hurricane. The water is quite warm. Here is a Maximum Potential Hurricane Intensity for the Gulf of Mexico. It is courtesy of Center for Ocean-Land-Atmosphere (COLA).

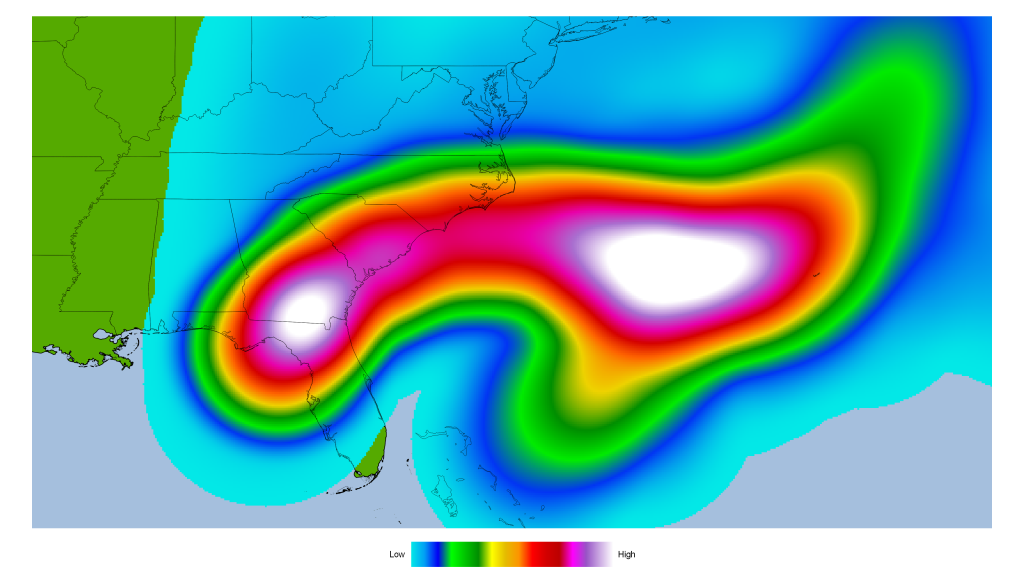
Idalia is over water that could support 880 millibars and winds of over 175 mph (150 knots). It does have the potential to be a Category 5 hurricane if conditions are right. I am most inclined to predict that Idalia will be a Category 4 hurricane with 150 mph winds. The most pressing is where Idalia will make landfall. The forecast model is from National Center for Atmospheric Research (NCAR). It is a heat map generated by QGIS. The heat map use points within 300 mile/480 kilometers radius. I used the latest forecast, which is at 0000Z.

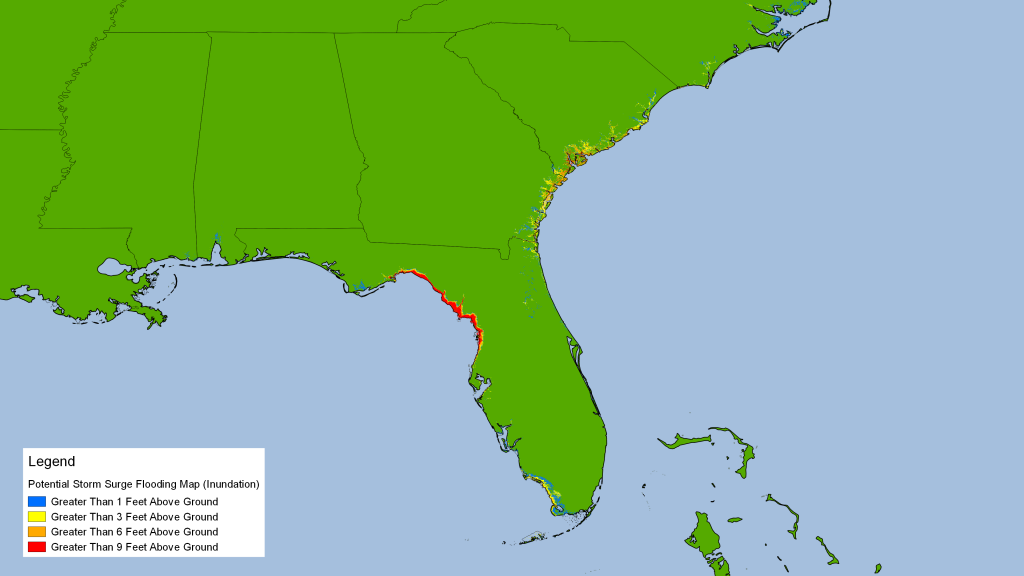
Most forecast models have Idalia heading towards the Big Bend of Florida. Big Bend is prone to storm surge due to large area of shallow water and shape of a funnel. Bays are vulnerable to storm surge as they have shallow water and funnel shape. Think Gavleston or Tampa Bay, which is one of the high risk area for storm surge. New Orleans, Houston, New York City, and Bangladesh are high risk for storm surge. Here is a storm surge map from the NHC. It is a potential storm surge flooding map.

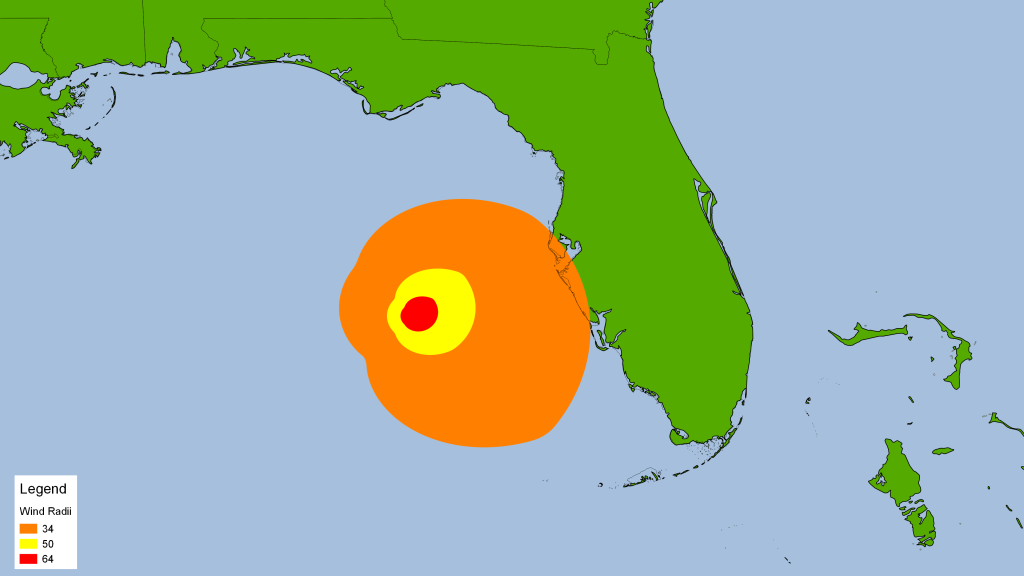
Some areas could see up to 15 feet storm surge, which is quite high. It could flood land areas with over 9 feet of water. That is dangerous storm surge. Anyone in the storm surge area should evacuate. Another factor for storm surge is size of storm and forward speed. Idalia is moving at 18 mph, which is rather fast. The speed could prevent Idalia from becoming a Category 5 hurricane. It is also a smaller hurricane. Here is a map wind radii for Idalia from NHC.

Tropical storm force winds extend up to 160 miles. Hurricane force winds extend up to 25 miles from the eye. Parts of Florida are already dealing with tropical storm force wind. The smaller size and relative fast speed of Idalia could make it less of a storm surge threat. Regardless, storm surge will be a dangerous threat for Florida.

Hurricane Idalia is going to be a dangerous hurricane. Anyone in storm surge area should of evacuated by now. Anyone inland should hide from the wind. It is going to be a rough ride.

Here is what I think will happen.
-Idalia will likely be Category 4 or 5 hurricane by morning.
-Idalia will likely make landfall on Florida by morning and near peak.
-Mostly will be a storm surge and wind event.

Historic Hillary

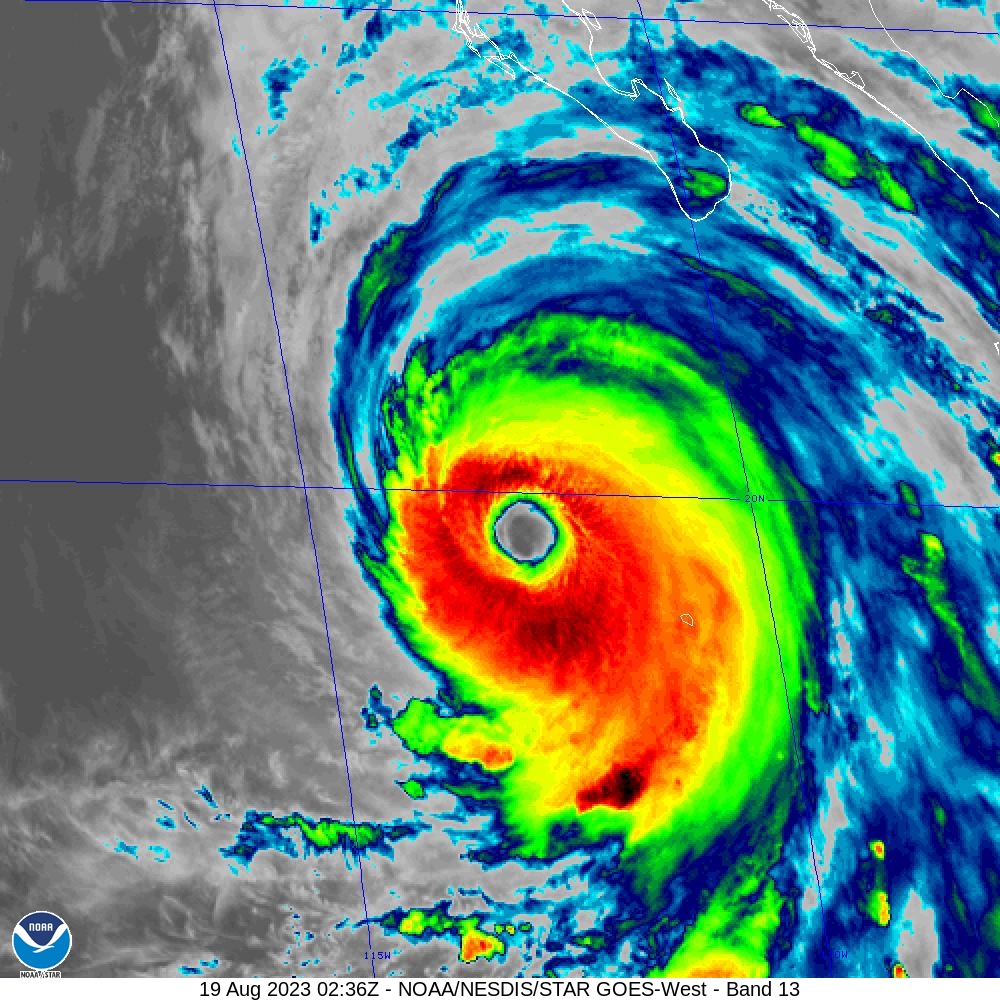
Hurricane Hilary at 19.1°N – 112.4°W
https://www.star.nesdis.noaa.gov/goes/floater.php?stormid=EP092023#homePageLink

Hurricane Hillary is a monster hurricane as a Category 4 hurricane with 130 mph winds as of 10:00 PM CST. It is quite large for a East Pacific Hurricane as it it has tropical storm force winds extending up to 255 miles! Most East Pacific hurricanes are small as the basin is smaller than Atlantic or West Pacific. The East Pacific produces many hurricanes due to warm water, less dry air, and North American Monsoon. Monsoon spin up thunderstorm clouds. In fact, it is the second most active basin in the world. Only the West Pacific is most active. Typhoon is for West Pacific, which is west of the International Date Line.

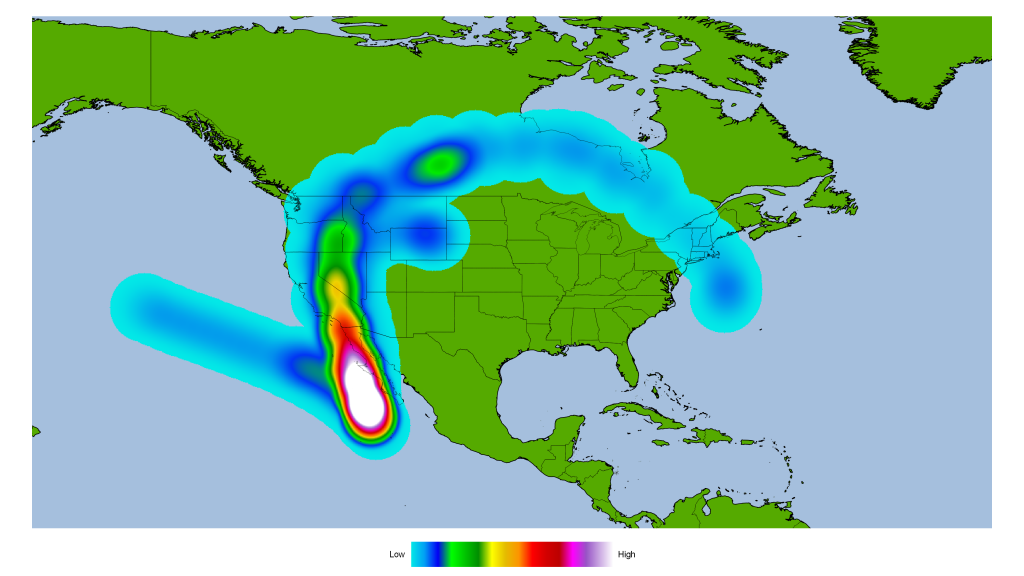
Here is the most recent forecast model for where Hillary will go. The forecast model is from National Center for Atmospheric Research (NCAR). It is a heat map generated by QGIS. The heat map use points within 300 mile/480 kilometers radius. I used the latest forecast, which is at 0000Z.

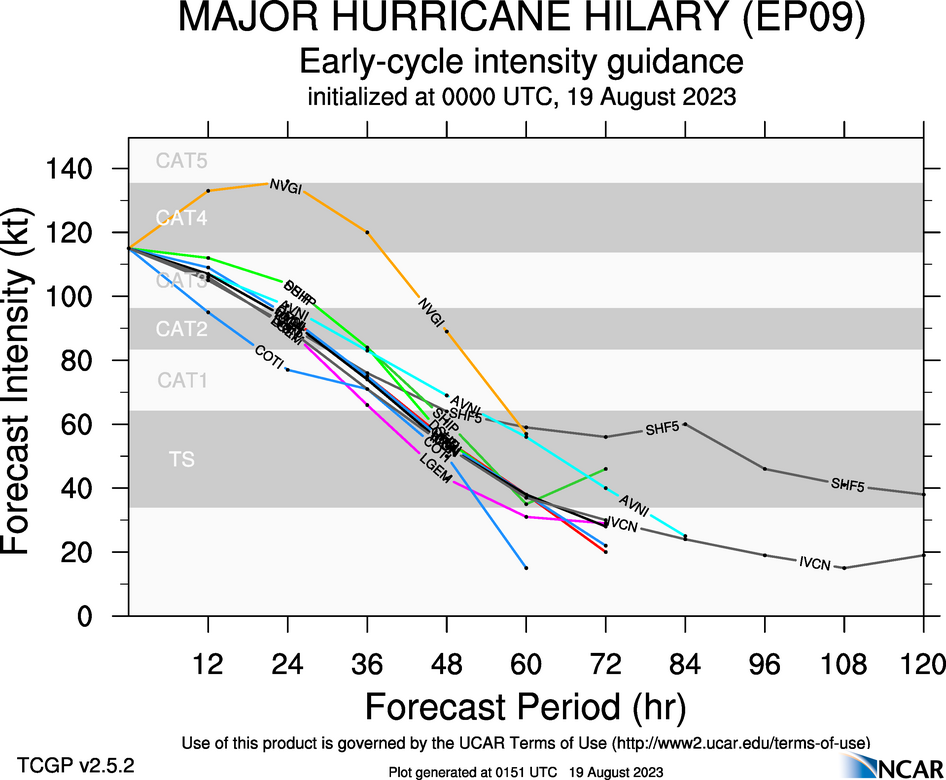
Most of the forecast models have Hillary heading northwards towards Baja California. From there, it could remain over Baja California or stay over the ocean and head towards Southern California. How intense will Hillary be by the time it comes close to Southern California? Here is an intensity forecast model from NCAR.

Most forecast models have Hillary weakening in 24 hours. The NVGI has it intensifying further. I would not be surprised if Hillary does intensify further. I think Hillary is most likely to weaken further. Most forecast models have Hillary as a tropical storm before it hits Southern California.

Tropical cyclones have hit Southern California in the past. It last happened in 1939, when it made landfall around Long Beach. It has been dubbed “El Cordonazo” or “The Lash of St Francis”, which is named by Mexican fishermen. The once hurricane dumped heavy rain over large area of Southern California. Some areas saw nearly a foot of rain. The storm claimed nearly 100 lives. San Diego was hit by a hurricane in 1858. The only recorded hurricane to hit California. It is very likely California has been hit by hurricanes prior to 1858. It reportedly dump heavy rain over a large area of Southern California. Both occurred during El Nino. East Pacific is more active during El Nino.

Tropical cyclones rarely hit California because the water is cooler, compared to the East Coast or Gulf Coast. Tropical cyclone remnants have impacted California and the American Southwest. They often provide beneficial rains.

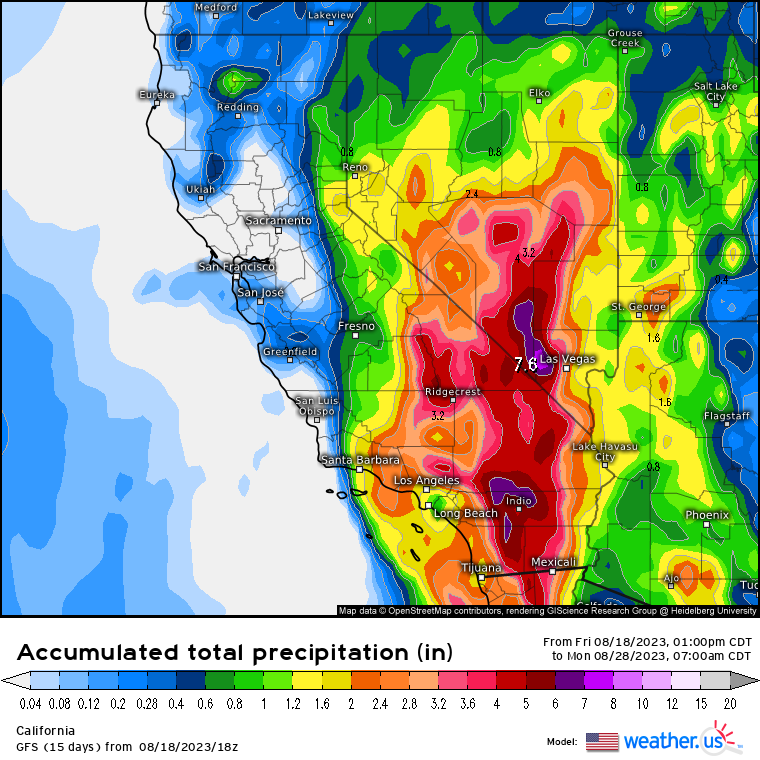
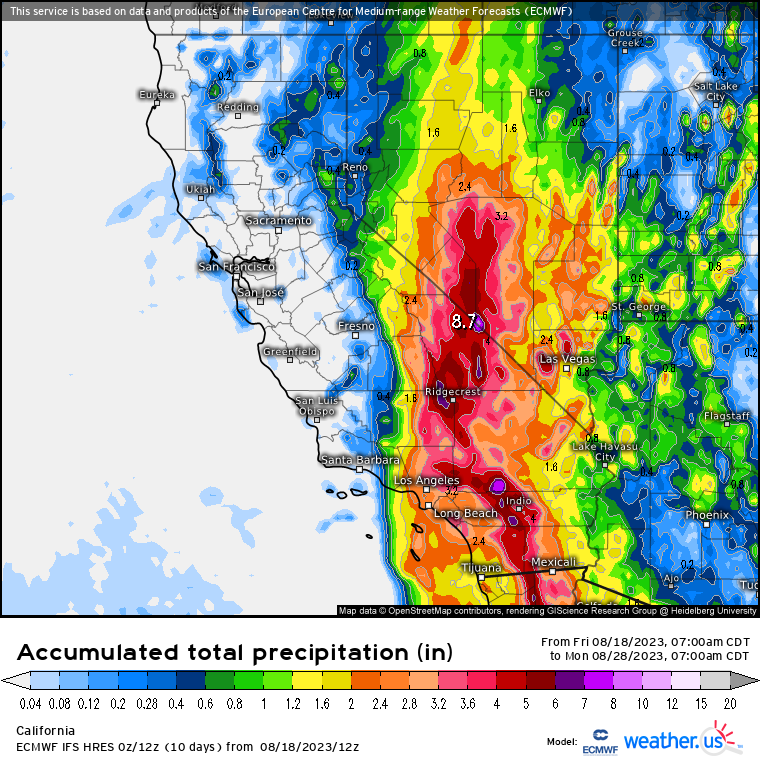
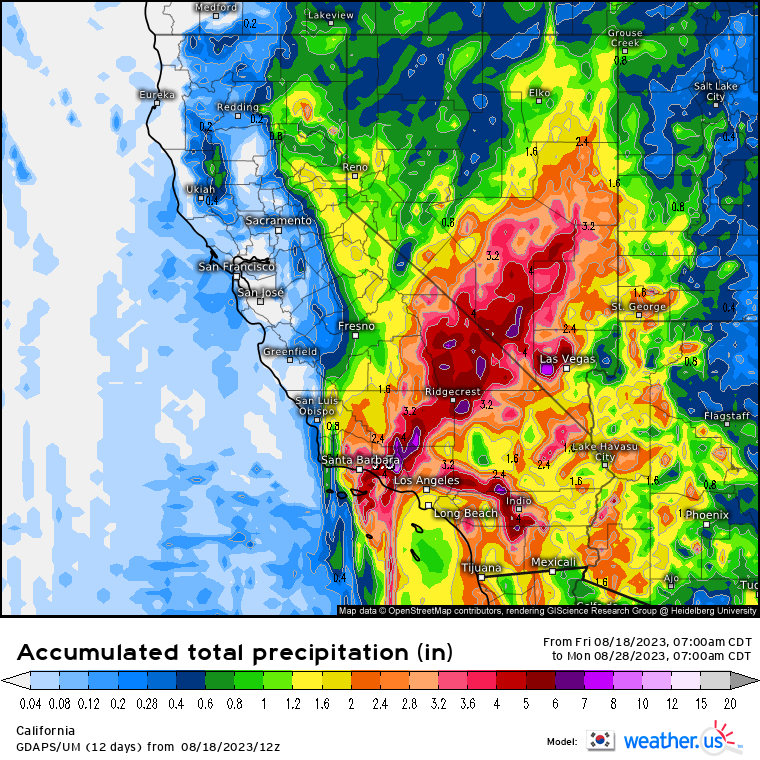
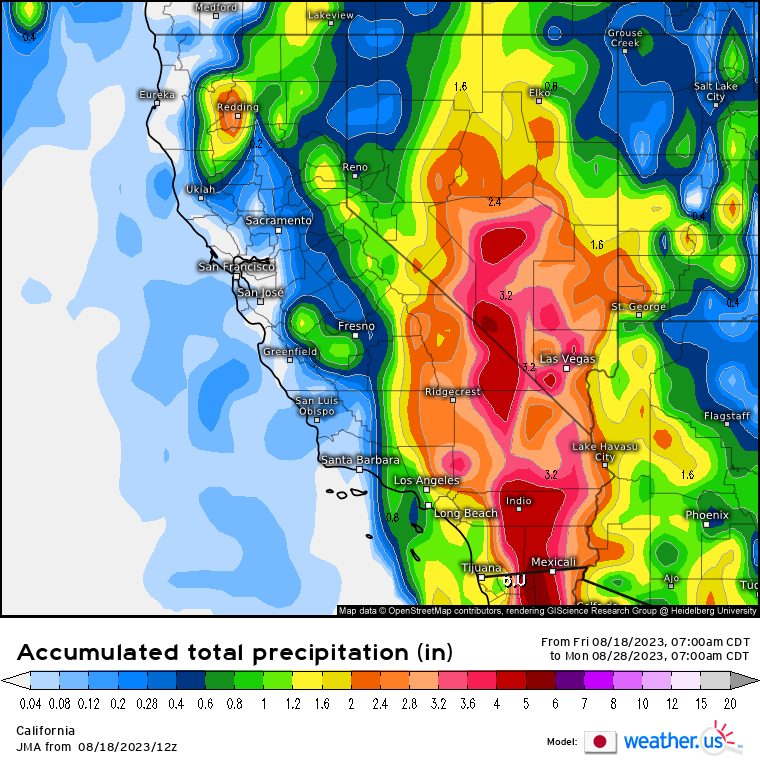
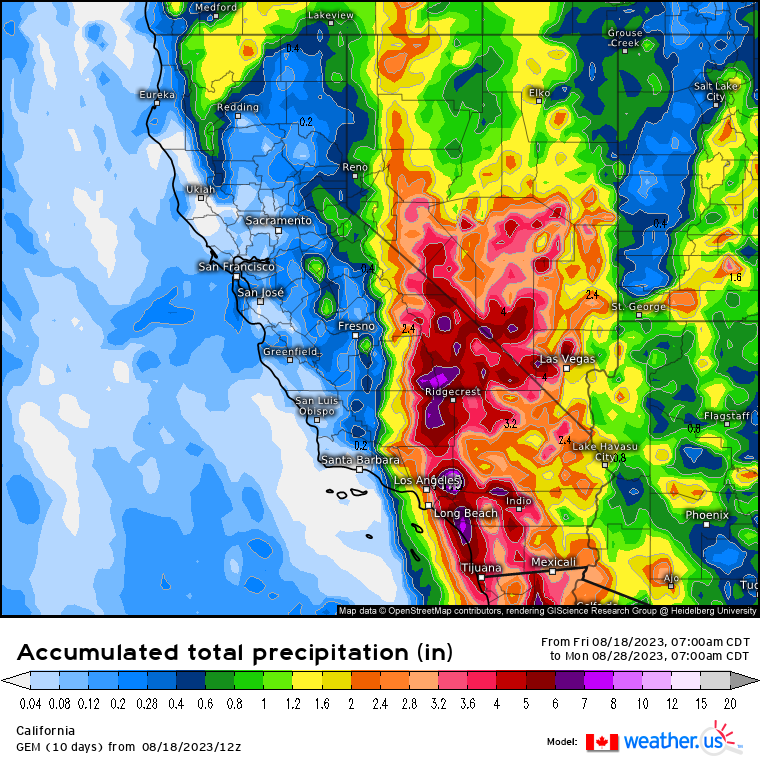
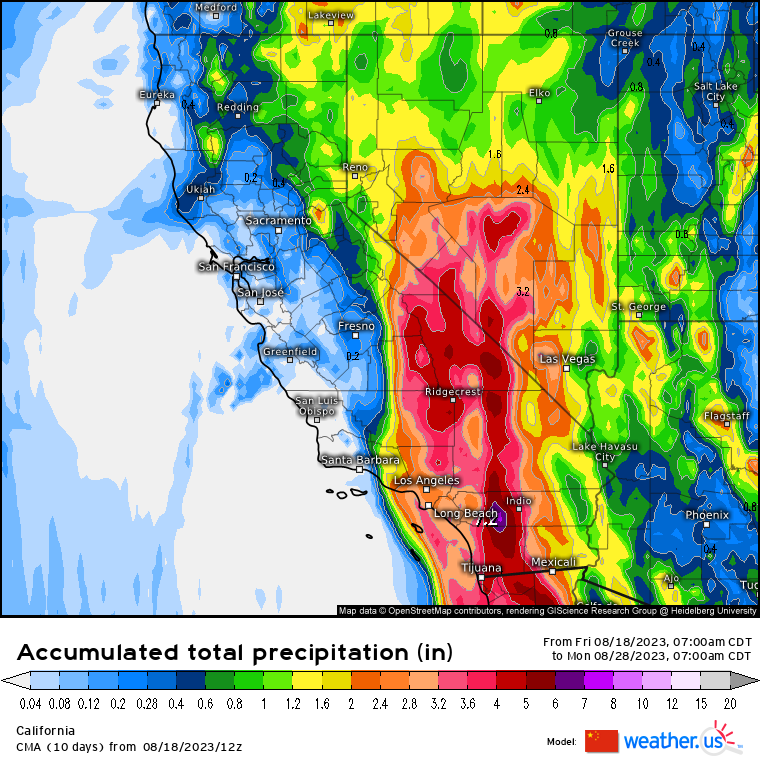
Here are rainfall forecast totals between August 18, 2023 to August 28, 2023. They are from Weather.US. The forecast models are:
GFS (American)
EURO (European)
GDAPS/UM (South Korea)
JMA (Japanese)
GEM (Canadian)
CMA (China)

GFS (American)
EURO (European)
GDAPS/UM (South Korea)
JMA (Japanese)
GEM (Canadian)
CMA (China)

The Canadian has the highest amount of 11.00 inches of rain. The Japanese has the lowest amount of 6.00 inches. I ran a statistical analysis using PSPP. I look at rainfall total forecast.

Mean8.38
Median8.15
Standard Deviation1.82
95% Confidence Interval Lower Bound6.47
95% Confidence Interval Upper Bound10.30

The mean rainfall total is 8.38 inches with median of 8.15 inches. The 95% Confidence Interval range are from 6.47 inches to 10.30 inches. It is probable the rainfall total will be somewhere between 7 to 11 inches of rain. There is a five percent chance that it is not in the true mean. It means it could be below 7 inches or over 11 inches. I can say with 95% confidence that the rainfall total is probably going to be somewhere between 7 to 11 inches of rain. More than likely, it is over 7 inches of rain.

I would not be surprised if some areas see over a foot rain. It would mostly likely be in the mountainous areas of California and Arizona. Mountainous areas on windward side are very wet. In fact, some of the wettest areas in the world are in mountainous areas.

Here is what I think will happen.
-Hillary is likely to weaken overnight.
-Hillary could make landfall on Baja California.
-Hillary is likely to make landfall as a tropical storm on Southern California.

The Aftermath Of Hurricane Ian

Wilfredo Lee – AP Photo

The magnitude of destruction from Hurricane Ian has come to light. The monster storm surge and strong winds ravaged Southwest Florida. It is nothing short of utter devastation for Southwest Florida. Fort Myers is utterly flattened. It looks like a war zone. Houses and buildings are flattened everywhere. The damage total is likely to be in the hundreds of billions of dollars.

Joe Raedle – Getty Images

The death toll is something I do not want to think about at this time. At least 10 people are known to have died. Lee County Sheriff Carmine Marceno thinks the death toll could be in the hundreds. The full extent is not even known yet. I would not be surprised if the death toll rises from Hurricane Ian.

Hurricane Ian is a Category 1 hurricane with 85 mph winds from the National Hurricane Center (NHC) as of 11:15 PM EDT. It is quite a large storm with tropical storm force extending up to 415 miles. Here is the most recent forecast model for where Ian will go. The forecast model is from National Center for Atmospheric Research (NCAR). It is a heat map generated by QGIS. The heat map use points within 300 mile/480 kilometers radius. I used the latest forecast, which is at 0000Z.

Most forecast models have Hurricane Ian making landfall in South Carolina. North Carolina should not let their guard down. Currently, South Carolina and North Carolina are experiencing tropical storm force winds. It is going to be a rough night and Friday for them. Could Ian further intensify before it makes landfall? Here is an intensity forecast model from NCAR.

Most forecast models keep Hurricane Ian as a Category 1 hurricane. I would not be surprised if Ian further intensifies. A Category 2 hurricane is not out of question for Ian. Coastal South Carolina is prone to storm surge. Hurricane Hugo ravaged South Carolina with storm surge as high as 20 feet in 1989. Hugo made landfall as a large Category 4 hurricane. I do not think Ian will be a major hurricane at this time.

Here is what I think will happen.
-Ian is likely to further intensify, possibly up to Category 2 hurricane.
-Storm surge will be the main threat for South Carolina.
-Heavy rain and flooding will be another threat.

I am going to leave you with this image. It is a scene that is being repeated all over Southwest Florida. It will likely be the case in South Carolina, North Carolina, and Virginia.

Naples Fire-Rescue Department via AP

Hurricane Ian, A Sense Of Deja Vu

Hurricane Ian just made landfall on Florida on September 28, 2022.
https://cdn.star.nesdis.noaa.gov/FLOATER/data/AL092022/Sandwich/

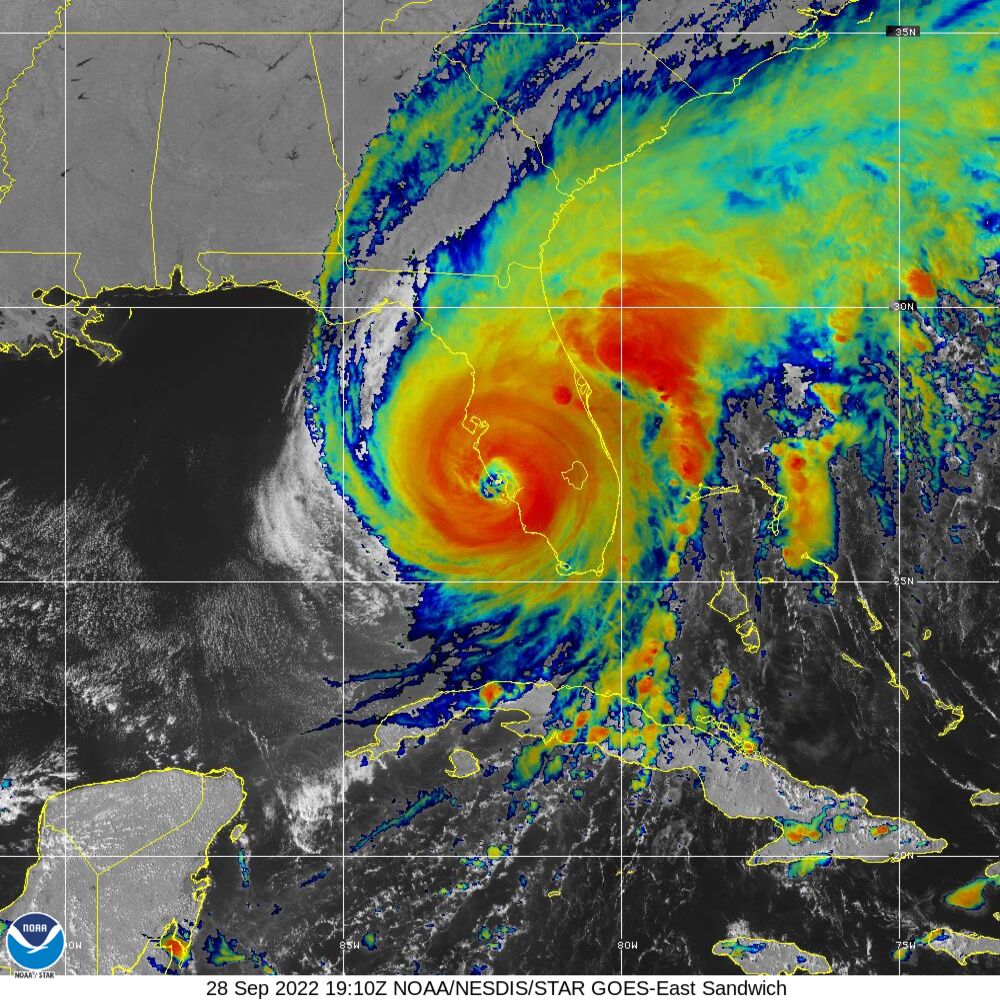
Hurricane Ian made landfall at 3:05 PM EDT on Cayo Costa and near Pirate Harbor at around at 4:35 PM EDT. Hurricane Ian made landfall as a Category 4 hurricane with 150 mph winds at Cayo Costa. Ian peaked at 155 mph winds and central pressure of 936 millibars. I would not be surprised if Ian gets upgraded to Category 5. Hurricane Ian gives a sense of deja vu with Hurricane Charley. Hurricane Charley made landfall on August 13, 2004.

Hurricane Charley from NOAA.
http://cimss.ssec.wisc.edu/satmet.2012-Feb-14/modules/wild_weather/charley/charley.html

Hurricane Charley made landfall at the almost same location where Hurricane Ian did. Even the landfall times are almost the same at 3:45 PM and 4:45 PM. Both had frontal boundary that impacted steering motion for them. Talk about eerily similar. However, there are differences between Charley and Ian.

Hurricane Ian is stronger with 155 mph winds and central pressure of 936 millibars at peak. Hurricane Charley peaked at 150 mph and 941 millibars. Charley is much smaller with hurricane force winds extending up to 25 miles from the eye. Tropical storm force winds extend up to 85 miles for Charley. Ian has hurricane force winds extending up to 45 miles from the eye. Ian has large tropical storm force winds extending up to 175 miles. Charley moved faster compared to Ian. The storm surge is much higher in Ian than in Charley. In terms of rain amount, Charley dumped 4 to 8 inches of rain. Ian has dumped over 12 inches of rain and still falling as of tonight (September 28, 2022). Charley is not a flood event, while Ian is looking to be a flood event.

Here are rainfall forecast totals between September 28, 2022 to October 6, 2022. They are from Weather.US. The forecast models are:
GFS (American)
EURO (European)
GDAPS/UM (South Korea)
GEM (Canadian)
CMA (China)

GFS (American)
EURO (European)
GDAPS/UM (South Korean)
GEM (Canadian)
CMA (Chinese)

The Canadian has the lowest amount of 16.80 inches of rain. The Korean has the highest at 42.20 inches of rain. I ran a statistical analysis using PSPP. I look at rainfall total forecast.

Mean24.92
Median20.4
Standard Deviation10.51
95% Confidence Interval Lower Bound11.87
95% Confidence Interval Upper Bound37.97

The mean rainfall total is 24.92 inches with median of 20.40 inches. The 95% Confidence Interval range are from 11.87 inches to 37.97 inches. It is probable the rainfall total will be somewhere between 12 to 38 inches of rain. There is a five percent chance that it is not in the true mean. It means it could be below 12 inches or over 50 inches. I can say with 95% confidence that the rainfall total is probably going to be somewhere between 12 to 38 inches of rain. More than likely, it is now over 12 inches of rain.

I would not be surprised if some areas in Florida see over 40 inches of rain from Hurricane Ian. If Hurricane Ian was to dump 40 inches or greater, that would be a record for Florida. The highest known 24 hour rainfall total for Florida is 38.70 inches in Yankeetown! The total rainfall from Easy is 45.20 inches, making it Florida’s wettest tropical system. It is probable some areas could of had higher rainfall totals from Easy. Ian could challenge Easy in terms of rainfall.

Here is what I think will happen.
-Ian is likely to weaken overnight.
-Ian is likely to be more of a heavy rain even for inland and East Coast of Florda.
-Storm surge will remain a problem for Florida.

Florida Under The Gun From Hurricane Ian

GOES-East of Southeastern US in Band 13.
https://www.star.nesdis.noaa.gov/GOES/sector.php?sat=G16&sector=se

Hurricane Ian has passed Cuba. It made landfall at around 4:30 AM Eastern Time in the Pinar del Rio province as a Category 3 hurricane with 125 mph winds. The highest wind on land is around 106 mph with gusts of 160 to 175 mph. The hurricane overwhelmed the Cuban power grid, which caused it to collapse. All of Cuba is out of power as of tonight. No words on casualties yet in Cuba.

The National Hurricane Center (NHC) has the eye of Hurricane Ian is over Dry Tortuga as of 10:00 PM Eastern Time. It is a Category 3 hurricane with 120 mph winds and central pressure of 947 millibars. Where does Ian go? Here is the forecast model from National Center for Atmospheric Research (NCAR). It is a heat map generated by QGIS. The heat map use points within 300 mile/480 kilometers radius. I used the latest forecast, which is at 0000Z.

Most forecast models have a southward trend compared to yesterday’s forecast model. It look like Tampa Bay was in the bull’s eye.

Hurricane Ian could make landfall south of Tampa Bay. That does not mean Tampa Bay is out of the woods yet. Forecast models are subject to change. Ian could make landfall between north to south of Tampa Bay. As Ian remains over the Gulf of Mexico, how strong will Ian be before it makes landfall? It is also from NCAR.

Most forecast models keep Ian as a Category 3 hurricane with one having it as a Category 4 hurricane. I would not be surprised if Ian intensifies again as strong as Category 5 hurricane. I think it will likely be a Category 4 hurricane with winds of 150 mph. It will likely make landfall somewhere along the Florida as a Category 3 or 4 hurricane.

Here are infrared satellite and Doppler radar simulation of what Hurricane Ian could look like upon landfall. They are from Tropical Tidbits. The first one is simulated infrared from Hurricane Analysis and Forecast System (HAFS) and second one is Doppler radar simulation from Hurricanes in a Multi-scale Ocean-coupled Non-hydrostatic (HMON).

The infrared simulation has a large Hurricane Ian that has intensified. It is interacting with the cold front. The Doppler radar simulation has a central pressure of 945 millibars with winds of around 125 mph. Here is a wind speed of Hurricane Ian upon landfall from HMON.

The HMON forecast model has a large Hurricane Ian making landfall. A large hurricane is likely to produce higher storm surge. Large storm surge would be a severe problem for Florida. Many areas in Florida would experience winds ranging from 60 to 90 mph with gusts of 90 mph to 144 mph. Keep in mind, there are just forecast models for Hurricane Ian.

Florida better be prepared for the worst from Hurricane Ian. It is going to be a long few days for Florida.

Here is what I think will happen.
-Ian is likely to undergo rapid intensification to a Category 4 hurricane.
-Ian will make landfall somewhere along the West Coast of Florida on Wednesday evening or night.
-Storm surge will likely very damaging for Florida.

Hurricane Ian And The Next Few Days

GOES-East of Gulf Of Mexico in Band 13.
https://www.star.nesdis.noaa.gov/GOES/sector.php?sat=G16&sector=gm

Hurricane Ian is currently a Category 2 hurricane as of 11:00 PM from the National Hurricane Center (NHC). Ian has 105 mph winds and central pressure of 962 millibars. It is getting closer to Western Cuba. It is going to be a long and rough night for Western Cuba. Once Ian passes Western Cuba, it will enter the warm Gulf Of Mexico. Where does Ian go? Here is the forecast model from National Center for Atmospheric Research (NCAR). It is a heat map generated by QGIS. The heat map use points within 300 mile/480 kilometers radius. I used the latest forecast, which is at 0000Z.

Most of the forecast model have Ian heading towards Florida. One has it going westward towards Louisiana, which is unlikely. Tampa Bay Area looks like it is in the bull’s eye of where Hurricane Ian could make landfall. The other question is how strong will Ian be? It is also from NCAR.

Most intensity forecast have Ian as a major hurricane by tomorrow. Most keep it as Category 3 with one having Ian as a Category 4. I consider intensity forecast models to be unreliable. I think Ian is undergoing rapid intensification. I would not be surprised if Ian becomes a Category 5 hurricane. The waters around Cuba and Eastern Gulf Of Mexico can support a Category 5 hurricane. Here is a Maximum Potential Hurricane Intensity for the Gulf of Mexico. It is courtesy of Center for Ocean-Land-Atmosphere (COLA).

If conditions are right, Ian has the potential to have a central pressure of 880 millibars or lower with winds of over 190 mph. That is if the conditions are near perfect. I do not think Ian will have a central pressure of 880 millibars or lower and have 190 mph winds. North of Ian, there is strong wind shear. Here is a wind shear map from CIMSS.

Wind shear is what tends to prevent hurricanes from reaching their maximum potential. Ian at most is likely to have 160 to 165 mph winds and central pressure of 910 to 930 millibars. There is a stationary cold front, which is producing wind shear. That is likely to make Ian move slower. The slower Ian moves, the higher chance for heavy rain and storm surge. Slower moving hurricanes produce higher storm surge. If Ian was to slow down, the storm surge is going to be a severe problem for the Tampa Bay Area.

The Tampa Bay Area have not had a major hurricane make landfall since 1921. It is the 1921 Tampa Bay or Tarpon Springs Hurricane of 1921. It was a Category 4 hurricane that made landfall on October 25, 1921 with 120 mph winds. It produced storm surge of 11 feet in Downtown Tampa. It was likely a large hurricane when it made landfall. The hurricane claimed 8 lives. If it happened today, it would be catastrophic for the Tampa Bay Area.

Tampa Bay is one of the most vulnerable to storm surge. The bay is a large area of shallow water. It also a funnel shape. Those combinations are very conducive to high storm surge. One reason why the areas off of Louisiana and Mississippi, Southeast Texas, Big Bend Coast of Florida, New York City, and Bangladesh have high storm surge.

Corelogic did an analysis of most vulnerable for hurricane in terms of property damage. Tampa has a high risk for storm surge and hurricane winds, which makes them vulnerable. New York City is the most vulnerable to storm surge and hurricane winds.

Here is what I think will happen.
-Ian is likely to undergo rapid intensification.
-Ian will make landfall on Western Cuba as an intensifying Category 3 hurricane.
-Ian could be Category 5 hurricane once it is over the Gulf Of Mexico.

Harvey: 5 Years Later

It is hard to believe, it has been five years since Hurricane Harvey made landfall near Port Aransas as a Category 4 hurricane with 130 mph winds. So much has happened since Harvey from COVID-19 Pandemic to Ukraine War. Harvey is the first major hurricane to make landfall on America since Wilma on October 24, 2005. Harvey made landfall on August 25, 2017. That is 43,23 days apart or 11 years, 10 months, 1 day or 142 months apart!

South Texas is hammered by strong wind, storm surge, and heavy rain. It packs a devastating punch. It is mainly along the coast in the Port Aransas area.

Port Aransas after Hurricane Harvey.
https://www.weather.gov/crp/hurricane_harvey

Once Harvey made landfall, it starts to weaken. Harvey is lingering over Texas. Large thunderstorms form near the center on the afternoon and evening of August 26, 2022. The large area of thunderstorms move toward Houston.

Doppler radar of Hurricane Harvey from National Weather Service.

The thunderstorms go over Houston area dumping heavy rain on the night of August 26, 2017 to the small hours of August 27, 2017. Heavy rain falls over and over on the Houston area.

NWS HGX Radar Showing Heavy Rain Falling Over the Area along with Active Warnings @ 4:07AM on 8/27/17
https://www.weather.gov/hgx/hurricaneharvey

Houston area is flooded. Large areas receive 15 to 35 inches of rain from Harvey! Many houses and buildings are flooded as bayous and rivers are overflowing from heavy rain. Streets and freeways are flooded.

Flooding near Downtown Houston.
https://www.weather.gov/hgx/hurricaneharvey

Heavy rain continues to ravage Southeast Texas as Harvey lingers over Texas. Then Harvey exits Texas and goes over the Gulf of Mexico. Heavy rain falls over East Texas. Beaumont gets over 31 inches of rain including over 26 inches in a single calendar day on August 29, 2017!

I-10 at Jefferson/Chambers County Line via Dade Phelan
https://www.weather.gov/hgx/hurricaneharvey

Many areas saw over 30 inches of rain from Harvey. The highest recorded is 60.58 inches of rain in Nederland. Some areas likely got over 60 inches of rain. A Personal Weather Station (PWS) in Baytown recorded over 66 inches of rain during Harvey from August 25-31, 2017. The August 2017 total for that station is over 74 inches! I would not be surprised if some areas got up to 80 inches of rain from Harvey.

Once Harvey passed, it did $125 billion in damage, which is comparable to Hurricane Katrina in 2005. 103 people lost their life from Harvey in Texas. It is the deadliest Texas hurricane since 1919. The 1919 Florida Keys hurricane claimed at least 284 lives in Texas. It is likely up to 1,000 people died. It is probable more people died during Harvey, but were not counted.

Hot July 2022

The headlines have been dominated by heat waves, wildfires, and floods. America is engulfed in a heat wave regardless of region. The heavy rain and floods claimed at least 37 lives in Eastern Kentucky. Eastern Kentucky has a heat wave on top of it. Northern California has been ravaged by wildfires. July 2022 has been the hottest on record for Houston. It eclipses July 1980, in which America was in midst of a heat wave. How does July 2022 compare for Houston and America? Let’s start with Houston.

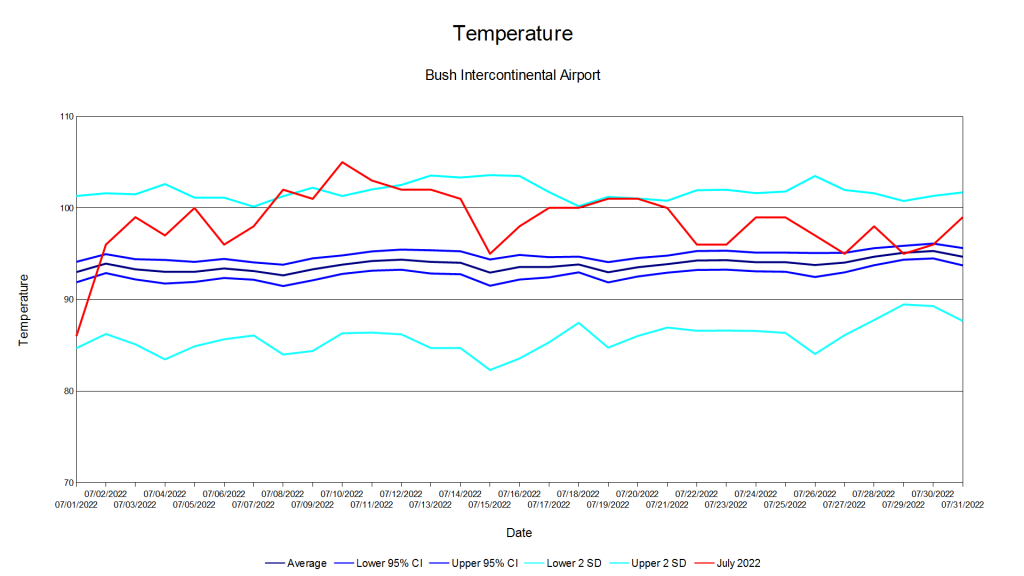
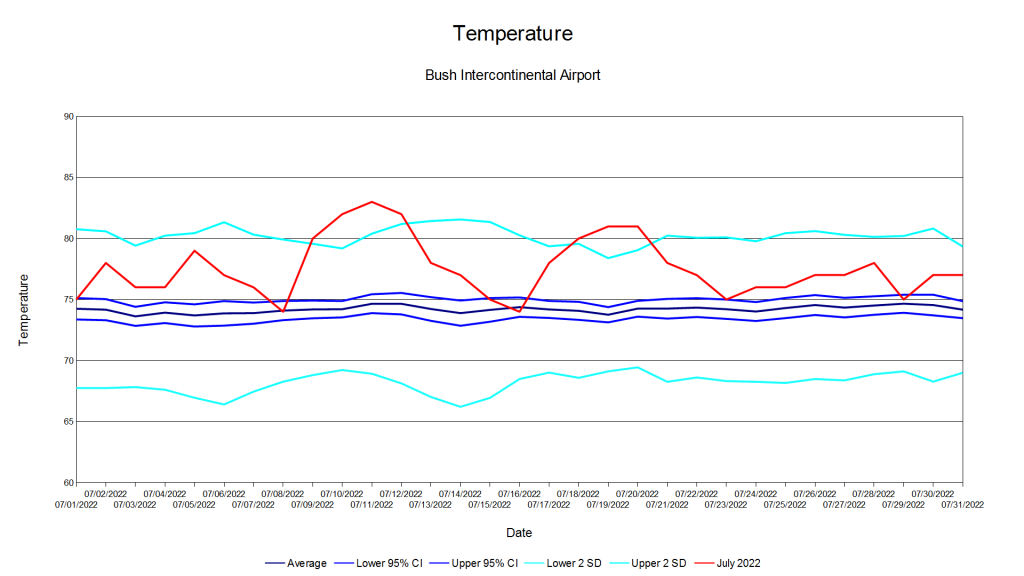
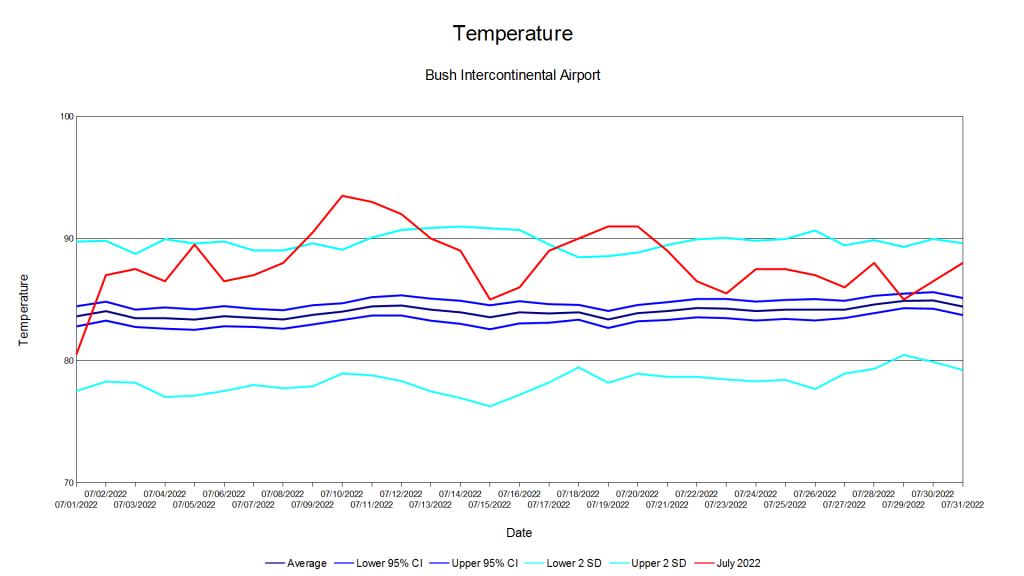
Here are charts of high, low, and average temperature for Houston, which is at Bush Intercontinental Airport. The data is from Global Historical Climatology Network – Daily (GHCN-Daily), Version 3. I calculated using JASP and generated graphs with Apache OpenOffice. The average and standard deviation are from 1969 to 2021. The charts have 95% Confidence Interval (CI), 2 Standard Deviations (2 SD) below and above, and actual temperature. Anything that is above or below 2 SD is considered unusual as it is 95% or greater to exceed the average or mean. Here is the high temperature for July 2022.

The hottest day was 105°F on July 10, 2022. It is the hottest July 10th recorded in Houston. It ties as the hottest July day on record in Houston with July 26, 1954. Houston recorded its hottest July 11th and 13th on record. There are days where July 2022 highs exceeded 2 SD. For the most part, the highs were within 2 SD. Certainly hot, but not extremely hot. Here is the low temperature for July 2022.

The low temperatures in July 2022 were likely to exceed 2 SD compared to high temperatures. There were often above average. There are no days where low temperature is below average. There are multiples days where lows exceeded 2 SD. The highest low temperatures recorded in Houston were on July 10-12 and July 18-20. They broke records for warmest low temperature recorded. The warm low temperatures contributed to July 2022 being warmest on record in Houston. Here is the average temperature for July 2022.

The average temperature exceeded 2 SD due to warm nights and days on July 10-12 and July 18-20. Let’s look at July 1980, the previous hottest July on record in Houston. Here is the high temperature for July 1980.

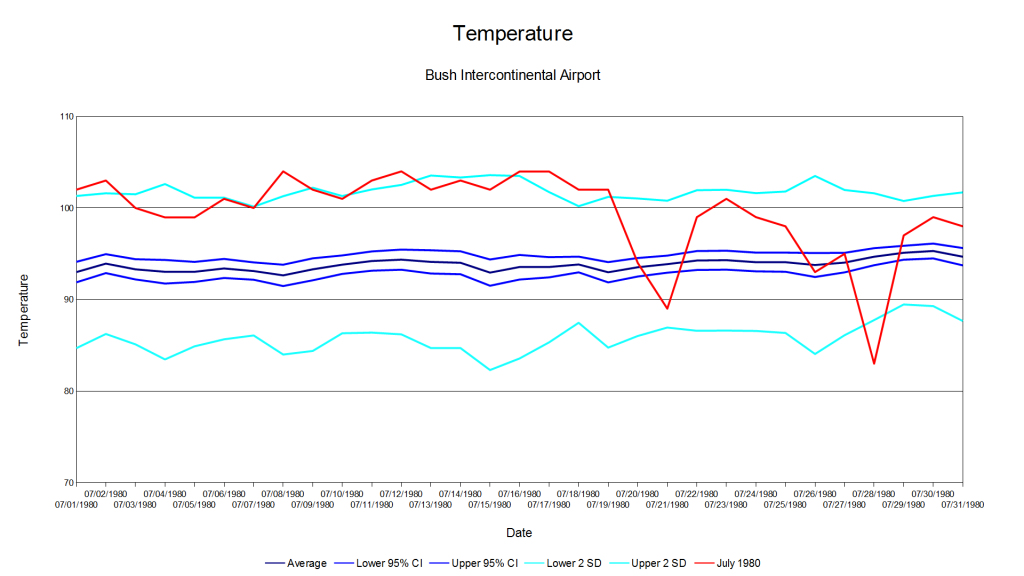
July 1980 highs were more likely to exceed 2 SD compared to July 2022. Many record July highs in Houston were set in July 1980. Texas and America were engulfed in a heat wave. The 1980 heat wave claimed at least 10,000 lives. The 1980 heat wave claimed more lives than 9/11, Hurricane Katrina or Hurricane Maria. July 1980 had more 100°F days than July 2022. July 1980 had 18 100°F days, while July 2022 had 13 100°F days. July 1980 is certainly hotter than July 2022 on that ground. Here is the low temperature for July 1980.

The low temperatures of July 1980 were within 2 SD. They were more likely to be within the average than July 2022. There were no record warm low temperatures set in July 1980, unlike in July 2022. There are some days in July 1980 that are below average. The low temperature is the reason why July 2022 is the warmest on record. If July 1980 had warm low temperatures of July 2022, it would easily exceed July 2022 as the warmest on record. Here is the average temperature for July 1980.

The average temperature exceeded 2 SD in July 1980. However, they are not on the level of July 2022 in terms of average temperature. July 1980 had normal low temperatures, while July 2022 had warm low temperatures, which kept things warm. Here is a 2 meter temperature anomaly of the Northern Hemisphere for July 2022. It includes America. It is from Daily Mean Composites.

It was certainly hot in America. It was also hot in Europe and East Asia. The cold weather are mostly in Russian Far East, Siberia, Central Asia, Alaska, and Northwest Canada. It was certainly hot in July 2022. Now, if you think July 2022 was really hot, try July 1936. Here is a 2 meter temperature anomaly of the Northern Hemisphere for July 1936. It is from 20th Century Reanalysis Daily Composites.

July 1936 was very hot in America. It was in midst of the Dust Bowl as there was the Great Depression. The Dust Bowl likely exacerbated the Great Depression as farmers suffered greatly. Many records were set in July 1936 and August 1936. The Summer of 1936 is the hottest on record for America. They are yet to be broken to this very day.

Texas’s hottest recorded day occurred on August 12, 1936 in Seymour. Seymour reached a high of 120°F. It also reached 120°F in Monahans on June 28, 1994. They are Texas’s highest recorded temperature and yet to be broken to this very day. Oklahoma’s hottest days (not a mistype as it happened more than once) recorded occurred four times in 1936 in Alva (July 18, 1936), Altus (July 19, 1936 and August 12, 1936), and Poteau (August 10, 1936) as they reached 120°F. They are yet to be broken in Oklahoma to this very day. North Dakota’s hottest recorded day occurred on July 6, 1936 in Steele with a high of 121°F. It is North Dakota’s hottest day recorded. It is yet to be broken to this very day for North Dakota. New York City’s hottest recorded day occurred on July 9, 1936 with a high of 106°F. It remains the hottest day recorded in New York City to this very day. The 1936 Annual Heat Wave Index in America is the highest. It easily exceeds 2022.

The death toll from the July 1936 heat wave is at least 5,000 people. There was a jump in mortality in 1936 compared to 1935. It suggests the heat wave claimed more than 5,000 lives directly and indirectly. America had over 128 million people in 1936. If the July 1936 heat wave happened today with the current population, the death toll would exceed at least 12,000 lives and likely higher.

July 2022 was certainly hot, but it does not come nowhere to July 1936. It was really hot back in 1936. People managed to survive as people did not have air conditioning. Few people had air conditioning in their homes. Some people slept outside at night as it was cooler outside than inside. I would not be surprised if there were heat waves comparable to and exceeding 1936 that occurred in the past.

What will August 2022 be like? We shall see.