It is Leap Day and it comes every four years. So, what is the weather like on Leap Day in Houston? Here is official weather records on February 29th. It is from NOWData – NOAA Online Weather Data.
Bush Intercontinental Airport 1969-2010 Year High Low Average Rainfall 1972 72 61 67 0.33 1976 78 57 68 0 1980 82 63 73 T 1984 55 28 42 0 1988 82 58 70 T 1992 82 48 65 0 1996 47 39 43 0.53 2000 80 57 69 T 2004 72 56 64 0.49 2008 78 57 68 T 2012 84 71 78 0 2016 78 55 67 0 2020 75 43 59 0
From 1892 to 2020, two (6.25%) Leap Days saw below 32°F, which were in 1928 and 1984. The winter of 1983-1984 was one of the coldest winters on record. Nine out of 32 (28.13%) Leap Day saw at least 80°F days. The warmest Leap Day occurred in 1932. Interestingly, it snowed on March 10, the latest measurable snowfall recorded in Houston. It is not very wet on Leap Day. In fact the record rainfall is 0.53 inches, which fell in 1996. It rained in 11 out of 32 (34.4%) Leap Day from 1924 to 2020. That includes trace of rain. There is more chance to see rain than to see 80°F Leap Days in Houston. There is no recorded snowfall on Leap Day in Houston.
Here are some interesting facts about Leap Day. Leap year occurs in year divisible by 4. However, there are exceptions when years that are divisible by 100, they are not leap unless they are divisible by 400. So the year 1900 is not Leap Year, while 2000 is Leap Year. That is why there is gap between 1896 to 1904. The purpose of Leap Year is meant to keep calendar in alignment with the Earth’s revolutions around the Sun, which is every 365 days, 5 hours, 48 minutes, and 46 seconds or 365.242199 days. Happy Leap Day!
An original post from 2018 that is reposted and changed.
It is hard to believe it has been 15 years since Hurricane Ike made landfall on Southeast Texas as a monsterous Category 2 hurricane in the early morning hours of September 13, 2008. Between the fifteen years a lot has happened since Ike. Before Ike came crashing in, Cyclone Nargis ravaged Burma (Myanmar) and claimed over 138,000 lives. Not too long after, there is the Sichuan Earthquake that claims nearly 88,000 lives. Ike made landfall seven years after the devastating 9/11 Terrorist Attacks, which destroyed the World Trade Center and claimed nearly 3,000 lives. Ike came three years after Hurricane Katrina, Rita, and Wilma ravaged the US Coast. Four years after the Indian Ocean Tsunami that ravaged Indonesia and Thailand.
After Ike, comes the collapse of Lehman Brothers during a severe recession. There is the deadly Haitian Earthquake that claims up to 316,000 lives and the Deep Horizon Oil Spill in 2010. Japan was hit by a deadly Tsunami that led to the Fukushima Nuclear Meltdown in 2011. Harvey came and flooded out Southeast Texas with heavy rain over a large area in 2017. Then comes COVID pandemic, which started in 2019, but did not get noticed until 2020. Ukraine and Sudan are currently mired in war.
Ike pelted Southeast Texas and Southwest Louisiana with hurricane force winds and heavy rain. Ike was the last hurricane to hit Texas prior to Harvey. Almost a nine year gap of no hurricanes hitting Texas, let alone a major hurricane. The last major hurricane to hit Texas prior to Harvey was Bret in 1999, which is 18 years.
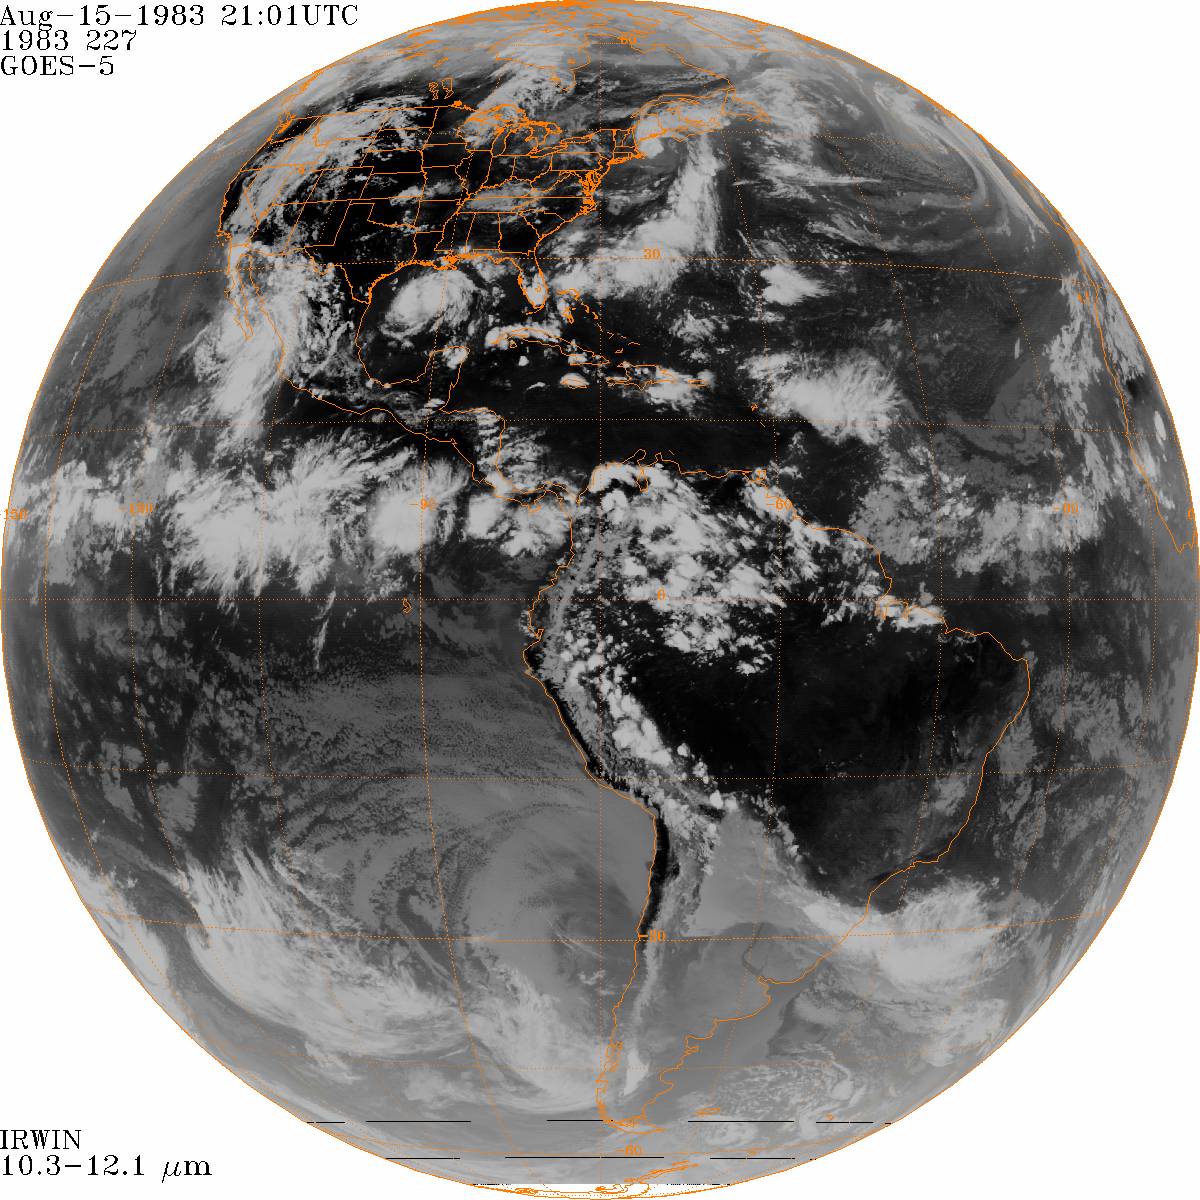
Thunderstorms over Sudan that later became Ike.
What is the origin of Hurricane Ike? Ike started as a mesoscale convective system (MCS) that formed over Sudan on August 19th. Most tropical waves come from thunderstorms that form in the Northeast part of Africa. They are set off by the Intertropical Convergence Zone (ITCZ) or monsoon. The ITCZ is where there is thunderstorms from the clash of trade winds. These thunderstorms often provide beneficial rains in tropical and subtropical areas. The thunderstorms in ITCZ can break away and travel away. One of those thunderstorms from the ITCZ managed to do that. The MCS traveled over Africa and entered the Atlantic Ocean as a tropical wave on August 29th. The tropical wave traveled across with multiple vortices competing. One of them would win out as the thunderstorms in the tropical wave get better organized on September 1, 2008. It is upgraded to Tropical Depression #9. Later that day, it is named Ike as it travels over the open Atlantic. Tropical Storm Ike has to deal with wind shear in the upper level early in its life. The wind shear blows tops of thunderstorms, especially westerly wind shear. Since 2008 season is Neutral to La Nina, conditions are more favorable as there is less westerly wind shear. If 2008 was El Nino, there would be more westerly wind shear, which is why generally El Nino Atlantic Hurricane seasons see less storms. Wind shear generally kills tropical development. The higher the storm clouds are, the cooler it is. Higher storm clouds also mean they are more intense.
However, Ike gets a reprieve as the wind shear weakens and encounter warmer waters on September 3rd. This allows Ike to rapidly intensify into a major hurricane. By the next day, Ike becomes 2008’s strongest hurricane with 145 mph 126 knots 233 km/h winds and central pressure of 935 millibars. Ike’s strength did not last as it encountered wind shear on September 5th. The wind shear weaken Ike to Category 2 strength.
Hurricane Ike around its peak.
Ike is pushed southwards into more favorable areas due to upper level ridge to the north. Ike becomes a Category 4 hurricane as conditions are more favorable. As it goes westward, Ike made its first landfall on Turks and Caicos Islands as a Category 4 hurricane on the early morning hours of September 7th. The Turks and Caicos Islands are the first to feel Ike’s violent wrath in the form of strong winds, heavy rain, storm surge, and high waves. The South Caicos and Grand Turk take the brunt of Ike. Despite Ike’s fury, there are no reports of fatalities.
Damage in Grand Turk.
While Ike is ravaging the Turks and Caicos Islands, the outer bands of Ike are dumping heavy rain on Haiti and Dominican Republic, which have been ravaged by Fay, Gustav, and Hanna. The flooding from Ike claims 74 lives in Haiti and 2 in Dominican Republic. Prior to Ike, Tropical Storm Hanna ravaged Haiti and Dominican Republic with heavy rain that led to massive flooding. The flooding claims 529 lives in Haiti, while just one dies in Dominican Republic. Why did Haiti see more fatalities than Dominican Republic? The lack of trees in Haiti makes it even more vulnerable to mudslides from the mountains. The heavy rain causes deadly mudslides that destroys houses and kill people.
Stranded Cubans following Ike.
Once Ike passes Turks and Caicos Island, Ike heads for Cuba. The hurricane makes landfall on Cabo Lucrecia, Holguín Province, Cuba. Cuba is in a very rough ride with Ike as it traverses over the entire island nation. Cuba is being pelted by heavy rain, strong wind, high waves, and storm surge. Briefly, Ike goes over the water only to make a second landfall on Punta La Capitana, Pinar del Río, Cuba on September 8th as a Category 1 hurricane. Ike claims 7 lives in Cuba.
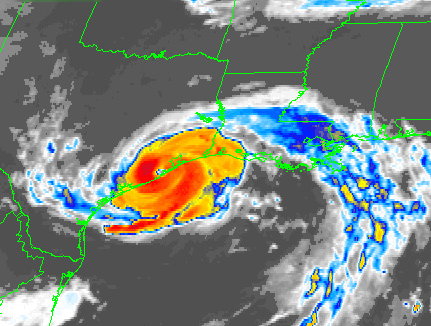
Ike near its secondary peak in Gulf of Mexico.
Once Ike exits Cuba, it is a large Category 1 hurricane. Ike traveling over all of Cuba caused the storm to expand as energy is spread out from land interaction. It also disrupted Ike’s core. Ike enters large area of warm water in the Gulf of Mexico and is getting close to the Loop Current, which is one of the warmest spot. Ike rapidly deepen from 963 to 944 millibars on the night of September 10th as it was over the Loop Current. However, the wind did not strengthen much, only from 80 to 100 mph 70 knots to 87 knots 128 km/h to 161 km/h. The reason is Ike is a very large hurricane with hurricane force winds extending up to 125 miles 109 nautical miles 201 kilometers from the eye. The pressure gradient is not tight due to its large size. Normally, an Atlantic hurricane with central pressure of 944 millibars is a Category 3 or 4 hurricane.
On September 11th, as America remembers and reflects the seventh anniversary of the 9/11 Terrorist Attacks, Southeast Texas is sunny and dry. The west side of a hurricane in the Northern Hemisphere is usually the “clean” side. It blows in dry and sinking air from the north. The nice sunny day is very deceptive as Ike is ever inching closer. Meanwhile in the Gulf of Mexico, Ike is generating massive waves that are heading towards the Texas and Louisiana. Ike continues across the Gulf of Mexico as a large Category 2 hurricane. Waves are coming ahead of Ike in coastal Texas. People are evacuating from coastal areas including Galveston. Some choose to stay behind. The outer cloud banks of Ike are over Southeast Texas as winds start to pick up. By the afternoon of September 12th, some coastal areas are getting squally weather from the feeder bands entering Texas.
By the night of September 12th, conditions have gotten much worse. Meanwhile in Houston area, it is still windy with occasionally light rain. As the night progresses, Ike is getting closer to landfall. The hurricane force winds enter Texas around the late hours of September 12th. Ike is getting stronger and developing a more organized eyewall. Ike now has a central pressure of 951 millibars and 110 mph 96 knots 177 km/h winds. Ike is a large hurricane with hurricane force winds extending up to 125 miles and tropical storm force winds extending up to 260 miles 226 nautical miles 418 kilometers.
Ike at landfall on Southeast Texas.
Highest wind gust possible based on multiplying by factor of 1.5.
By the early morning hours of September 13th, Houston area is seeing stronger winds and heavier rain. Power starts to go out throughout Southeast Texas as power lines are being knocked by the strong wind. The coastal areas are seeing storm surge getting higher and higher. Anyone who stayed behind in Galveston or Bolivar Peninsula are doomed by the massive storm surge. Ike makes landfall on the eastern end of Galveston Island at 2:10 AM Central Time. People who are staying behind in the coastal areas are wishing they had evacuated as they are surrounded by rising storm surge. Ike travels to the northwest towards Houston. By 4:00 AM, Ike is over Baytown, which is flooded by storm surge. A large area of Southeast Texas is getting hurricane force winds including all of Houston.
Highest sustained winds during Hurricane Ike.
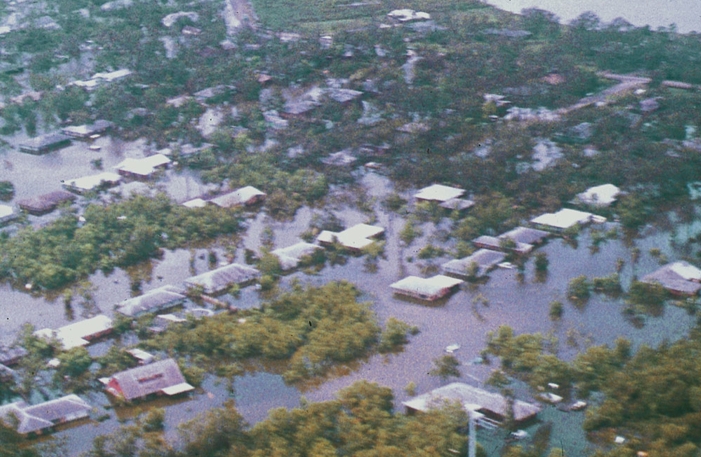
Bolivar Peninsula following Ike.
By the time the Sun rises, Ike is still ravaging Southeast Texas despite the fact it has weakened to Category 1 hurricane. Ike remains a monsterous and very dangerous hurricane. Many areas are still seeing heavy rain and strong winds. The wind blow down numerous trees and damage many buildings and houses. There is widespread flooding reported throughout Southeast Texas. Bayous and rivers are overflowing from widespread heavy rain. Coastal areas had storm surge as high as 25 feet/7.6 meters. It is one of the highest storm surge recorded in America and highest in Texas. It exceeds Camille, but below Katrina. Bolivar Peninsula saw the highest storm surge as the whole area looked like if a nuclear bomb had exploded. Once it is all over, many buildings and houses are damaged or destroyed, while many trees are uprooted. Coastal areas are utterly gutted from the massive storm surge. Millions of people are out of power for days. A large area saw 6 to 12 inches/15.2 to 30.5 centimeters of rain from Ike.
The damage is not just limited to Texas. Louisiana also felt the brunt of Ike, especially in Southwestern Louisiana. It is the same area that had been ravaged by Hurricane Rita in 2005. Many areas are flooded by Ike. There is even flooding in New Iberia, which is in Central Louisiana. It shows that Ike’s massive size had a huge impact over a large area from Texas to Louisiana. This is despite the fact that they only got tropical storm force winds. It shows that large, but not so strong hurricane is very dangerous as it produces massive storm surge and high waves.
Thunderstorms ahead of a cold front in the early morning hours of September 14, 2008.
The following night, a cold front passes, which allows thunderstorms to form from moisture left by Ike. The storms dumped 5 to 8 inches/12.7 to 20.3 centimeters of rain. The heavy rain causes more flooding on top of what Ike dumped in Southeast Texas. Once the rain ended, many areas saw a two day total ranging from 10 to 20 inches/25.4 to 50.8 centimeters of rain. Meanwhile, the remnants of Ike continue to wreak havoc in the Midwest. Ohio see hurricane force gusts, which causes more power outages. The remains of Ike continue into Canada and dump heavy rain in Ontario and Quebec. A total of 112 people lost their life with 34 unaccounted for in America. Most of the deaths are in Texas, where 84 people died.
Rainfall total from September 12, 2008 to September 15, 2008.
So, how was 2008 like prior to Ike. The winter of 2007-2008 is La Nina, so it is warmer and drier. Despite the La Nina, there are storms. Spring of 2008 is mostly dry. There were days of pleasant weather in Spring 2008. Summer of 2008 is average in terms of temperature and rainfall. Texas first brush with a hurricane is Dolly, which affected South Texas. The outer bands of Dolly dump heavy rain in the Houston area. Not too long after Dolly came, Tropical Storm Edouard pays a visit to Houston area. It is a rather unremarkable tropical storm that dumps up to 6 inches of rain. Edouard moves inland and gives beneficial rains to drought ridden Central Texas.
The Atlantic has heated up after it was dormant. Emily, Franklin, and Gert have formed. Only Franklin remains, but is out in the Caribbean. This brings us to Tropical Depression 9 or future Harold. Interestingly, Harold replaces Harvey, which ravaged Texas with heavy rain and flooding in 2017. I do not think this will be a repeat of Harvey by any stretch. Tropical Depression 9 is a tropical depression as of 10:00 PM CDT per National Hurricane Center. It has been hot and dry in Texas, so any rain is welcome. That leads to the question, where does Tropical Depression 9 go?
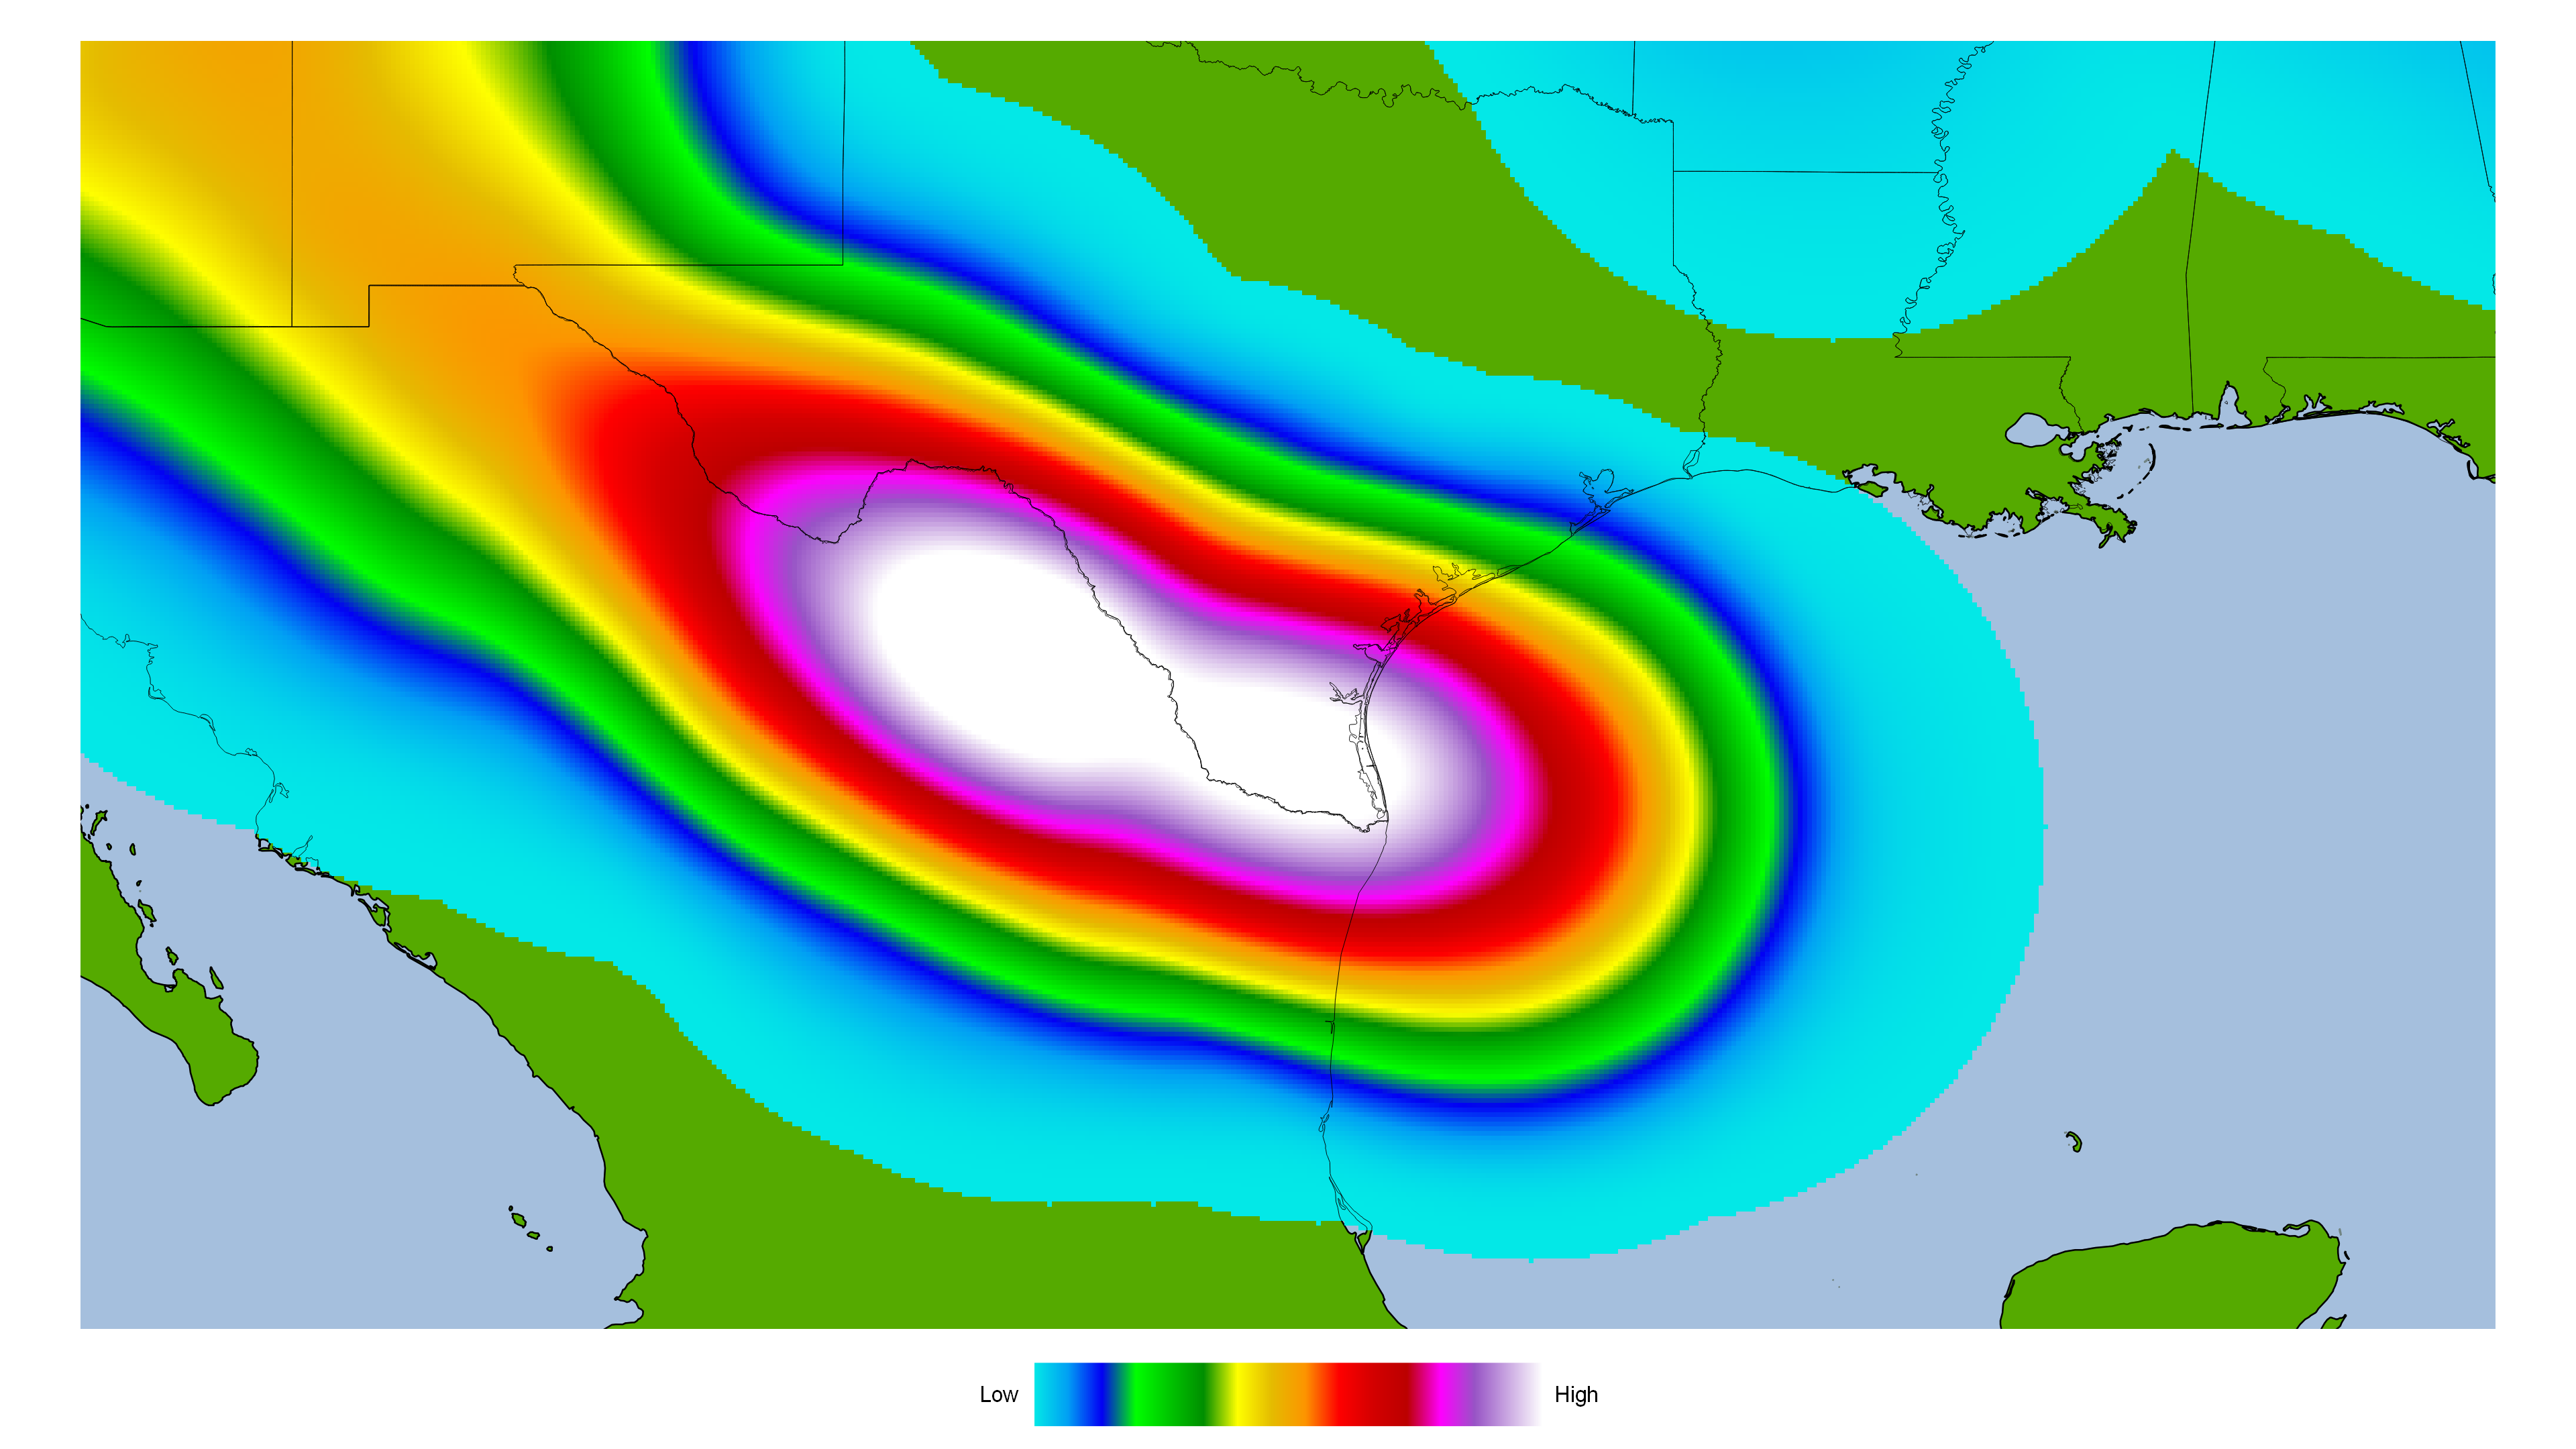
Here is the most recent forecast model for where Harold will go. The forecast model is from National Center for Atmospheric Research (NCAR). It is a heat map generated by QGIS. The heat map use points within 300 mile/480 kilometers radius. I used the latest forecast, which is at 0000Z.
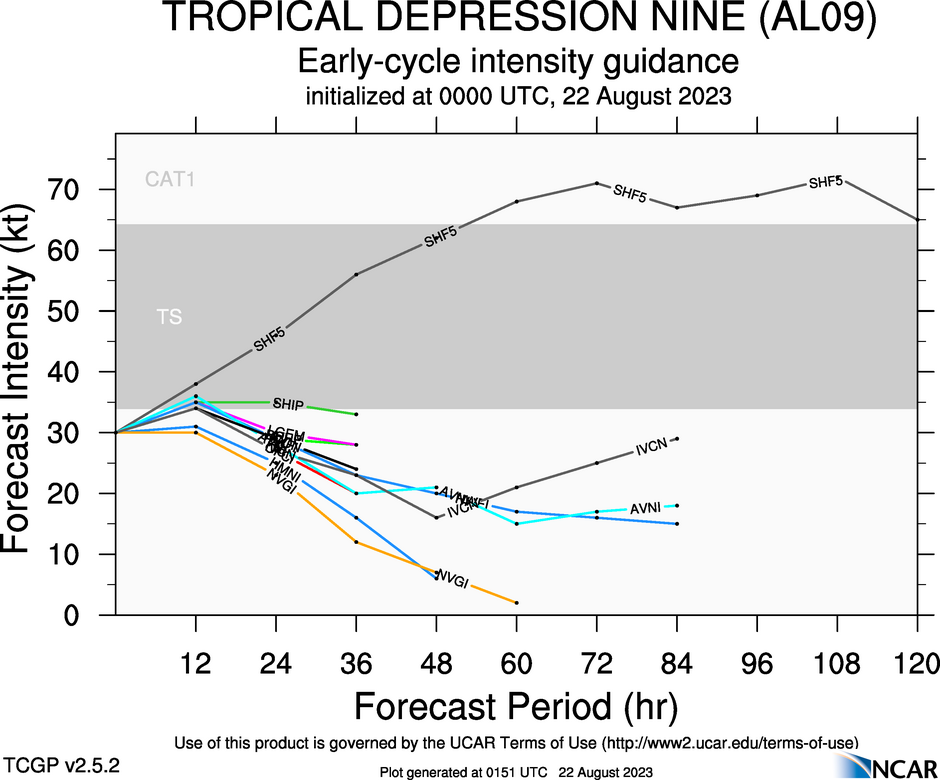
Most of the forecast models have Tropical Depression 9 heading towards South Texas. Some go far south as the mouth of Rio Grande River to far north as Corpus Christi. Most models have it going towards South Texas. There is a remote chance it could go towards Southeast Texas, but that is unlikely at this time. It currently remains a tropical depression. Here is the intensity forecast model from NCAR.
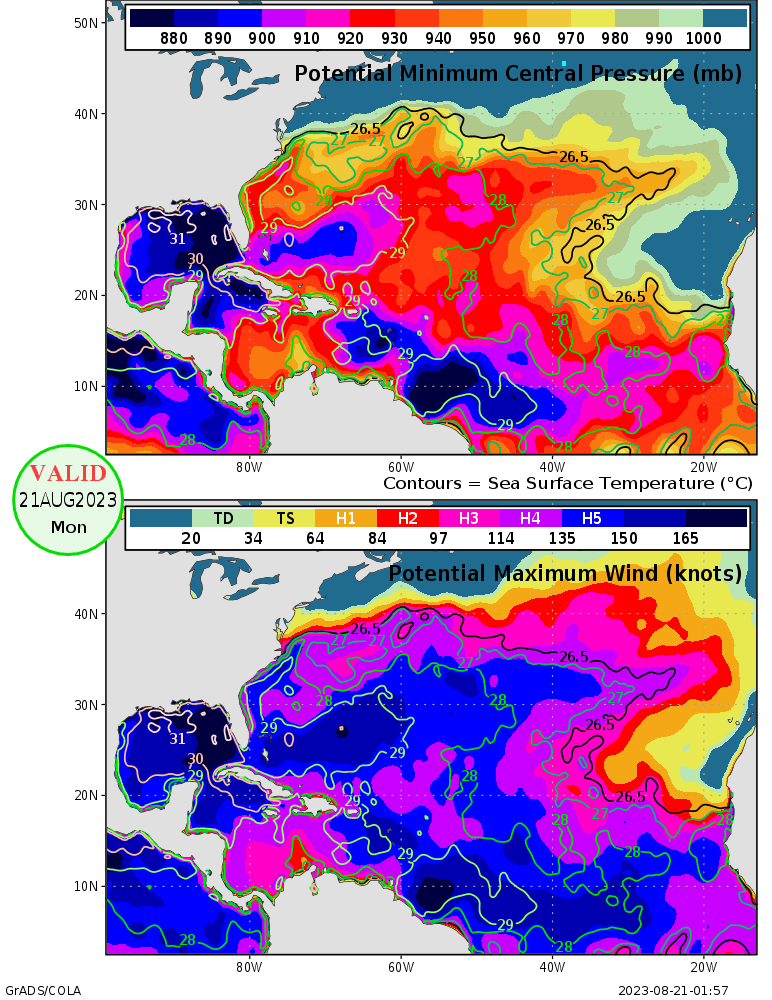
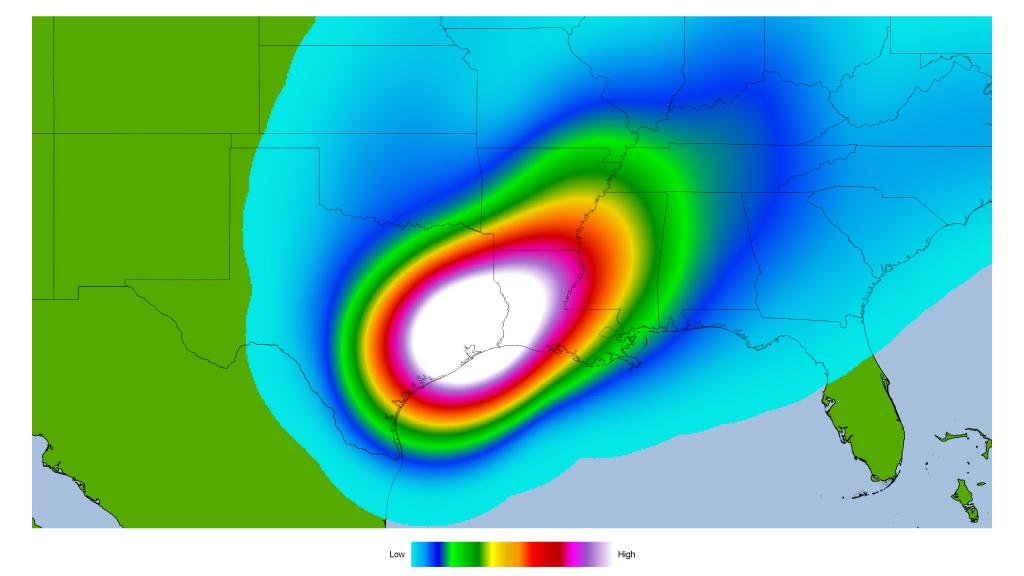
Most forecast models keep it as a tropical storm for a short time. One has it as a Category 1 hurricane, which keeps at as one far inland. The Gulf of Mexico is warm and can support Category 5 hurricane if conditions are right. Here is a Maximum Potential Hurricane Intensity for the Gulf of Mexico. It is courtesy of Center for Ocean-Land-Atmosphere (COLA).
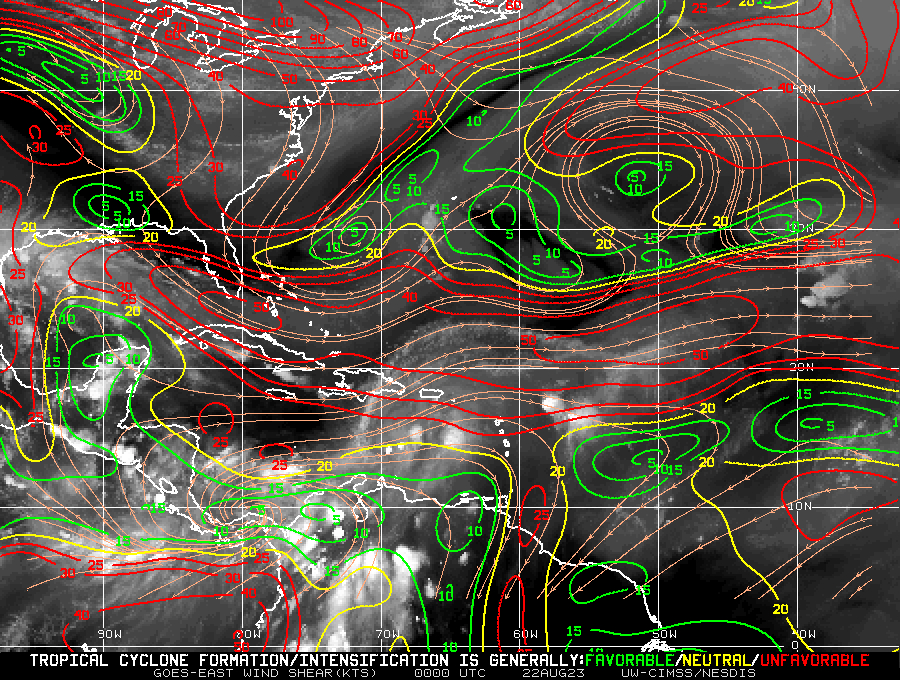
I would not be surprised if Harold becomes a strong tropical storm or even a Category 1 hurricane before landfall. A major hurricane is unlikely as it is moving rather quickly. That would keep a lid on any further intensification. Tropical Depression 9 also has to deal with strong wind shear. Here is a wind shear map from CIMSS.
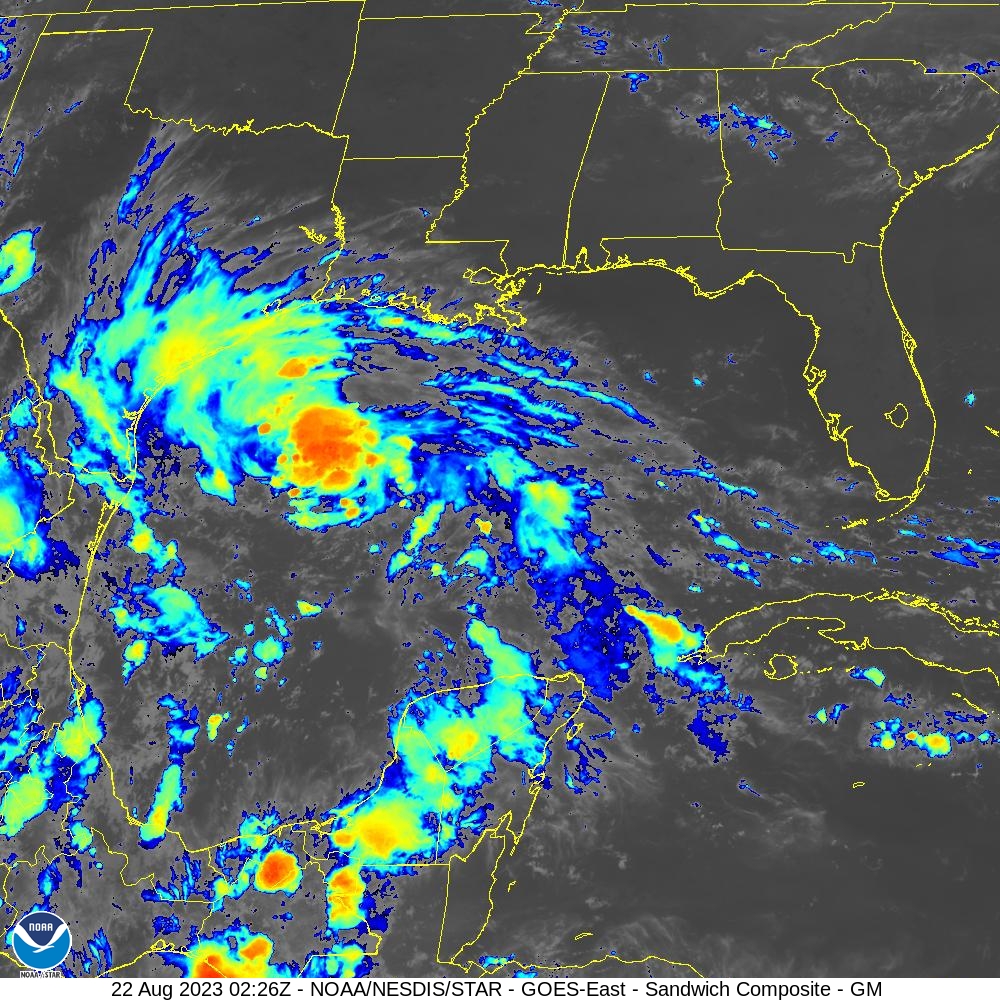
Wind shear and fast motion speed are likely to keep Harold as a tropical storm to Category 1 hurricane before landfall. Tropical cyclones have rapidly intensified right before making landfall on Texas. Something to not rule out with Harold. The satellite image of Tropical Depression 9 suggests it could be intensifying. There is also lightning near the center of future Harold. Here is a lightning flash map from GOES-East CONUS – Geostationary Lightning Mapper.
There was plenty of lightning near the center. It appears to have tapered off in terms of lighting. The circular shape also suggests it could be a tropical storm later tonight. The bandings around the tropical depression is also a sign Harold is about to form soon.
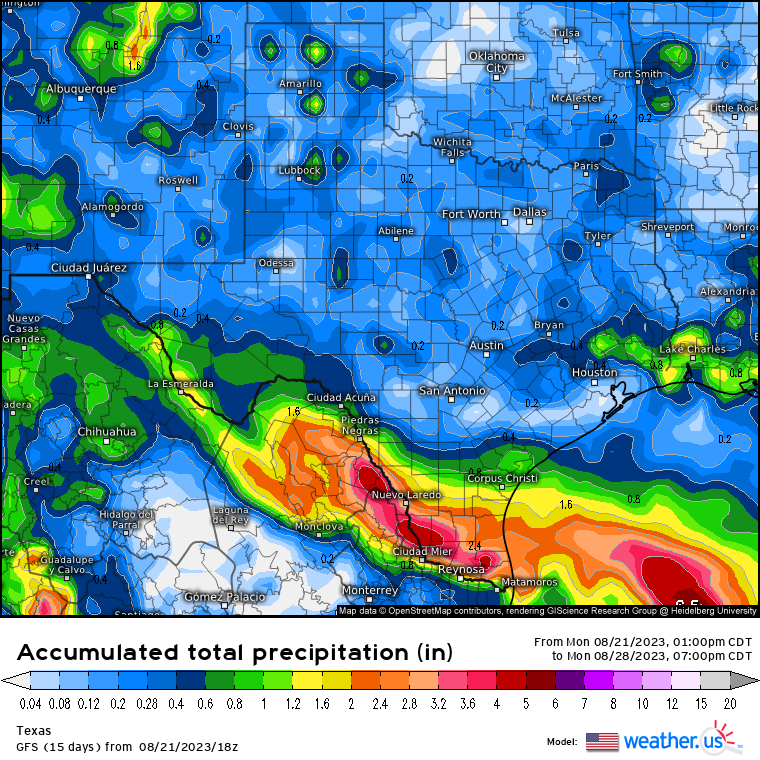
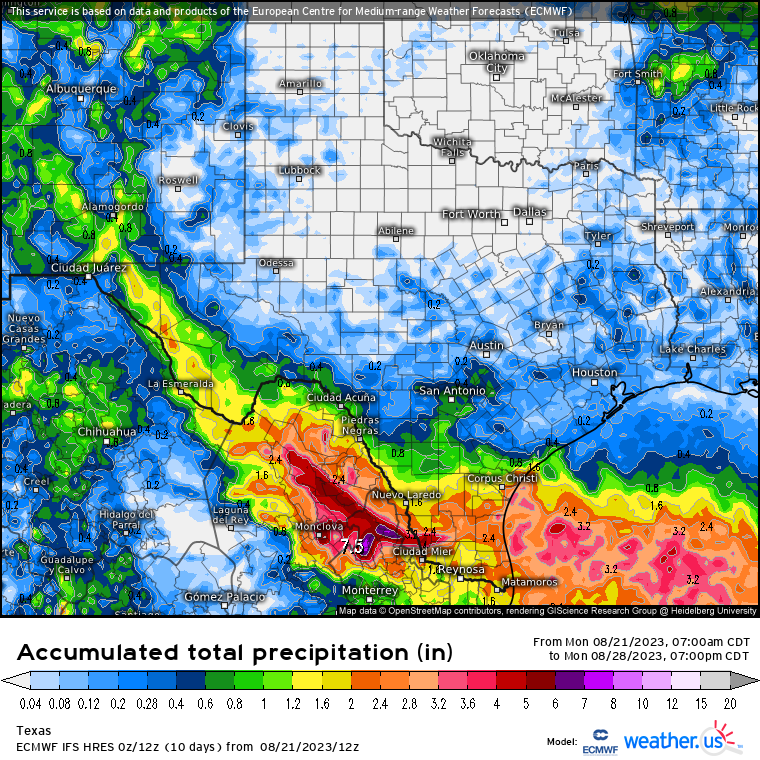
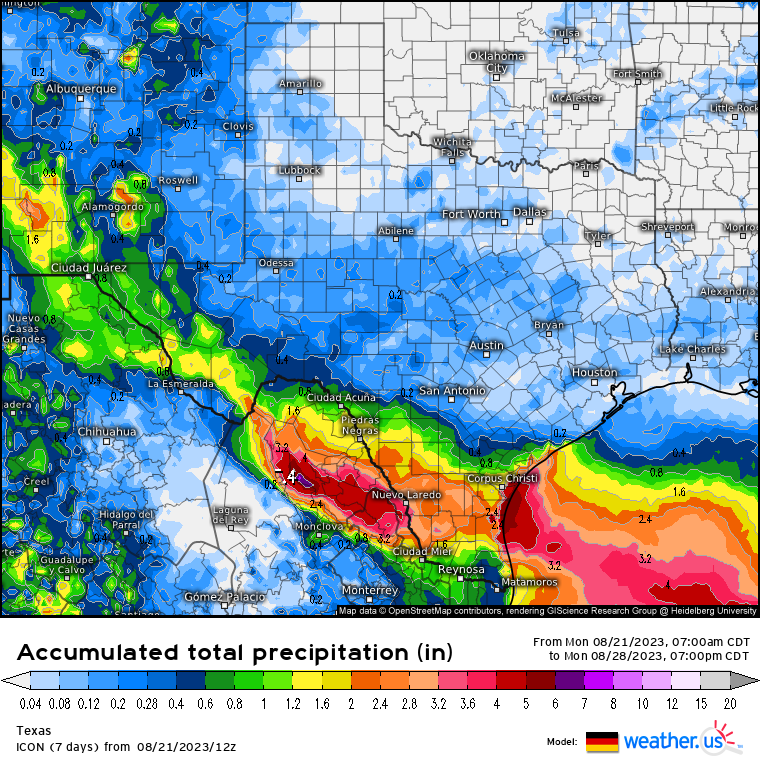
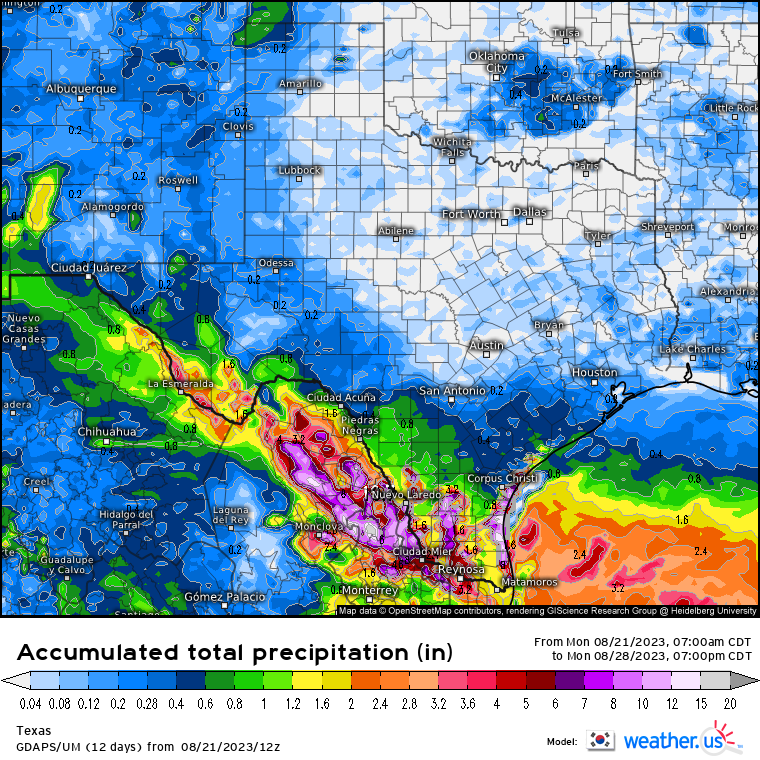
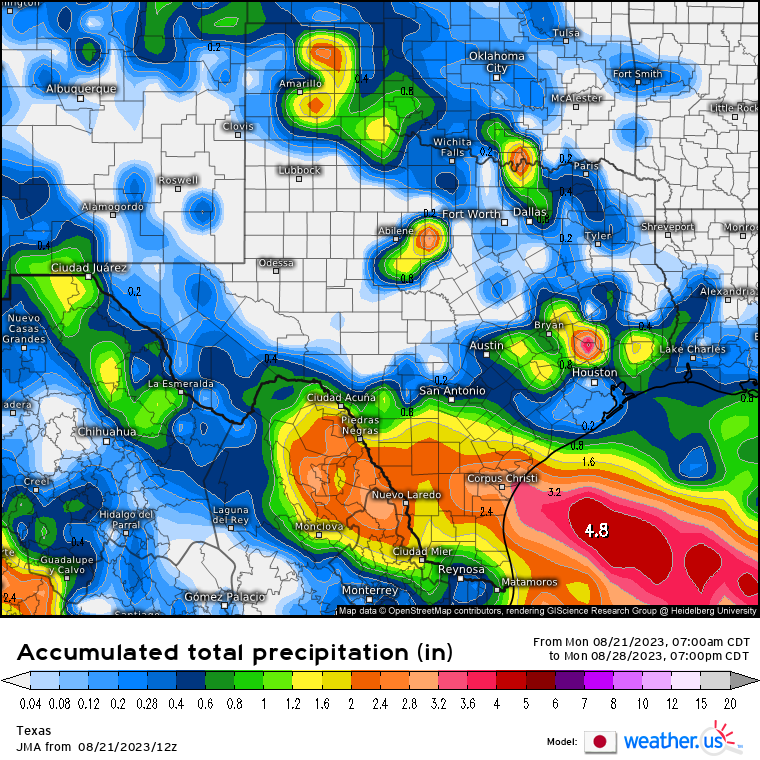
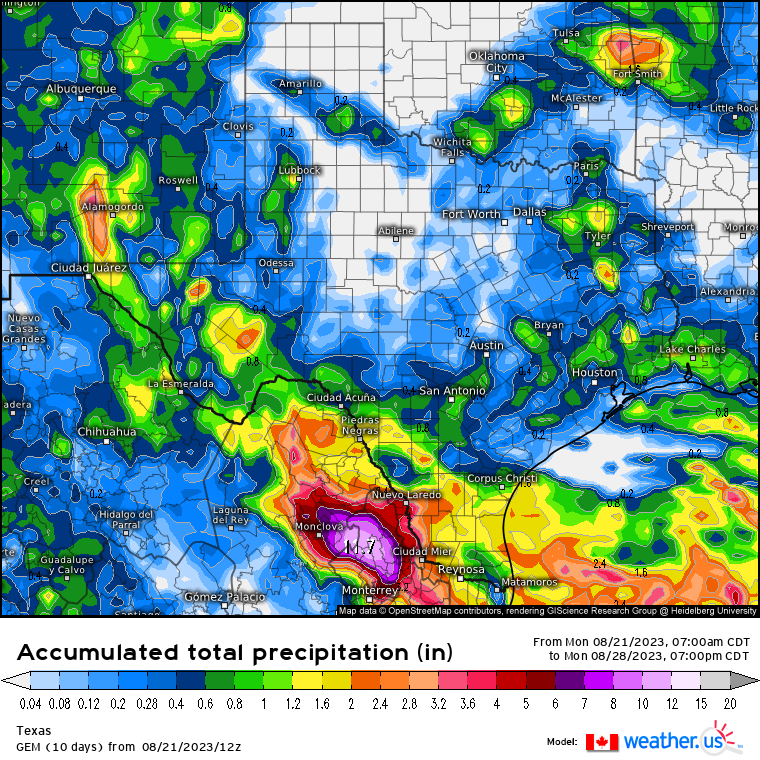
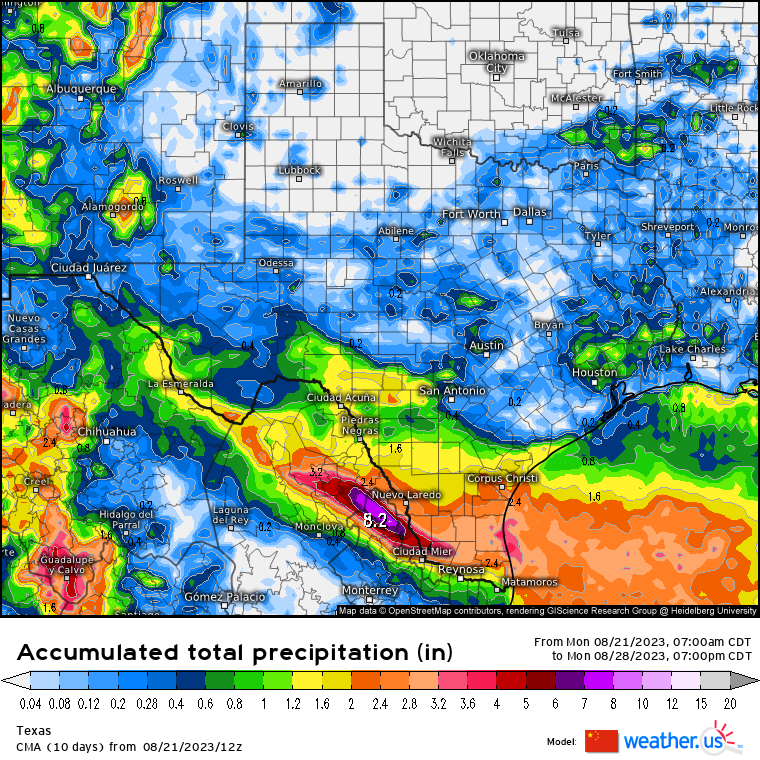
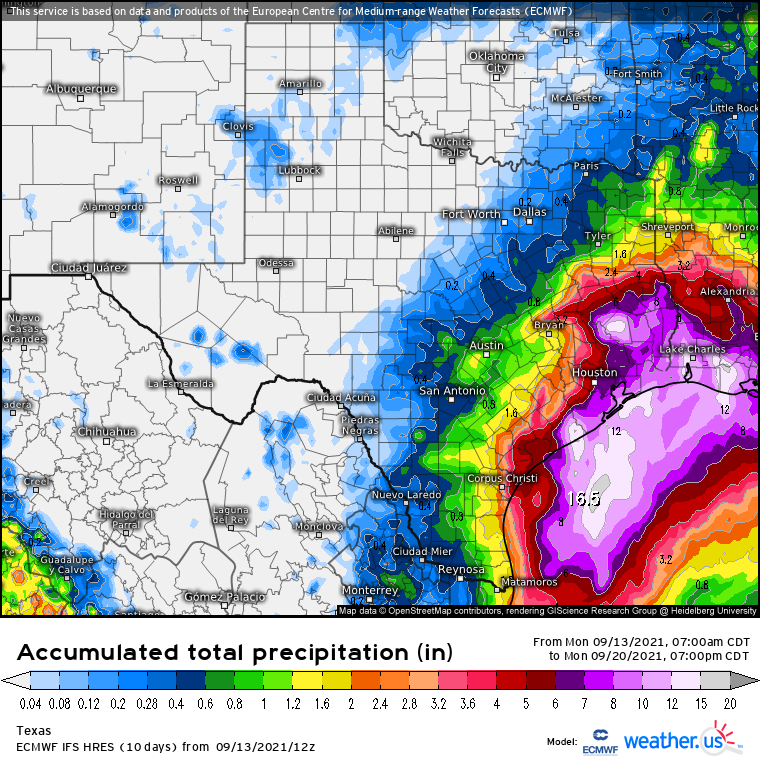
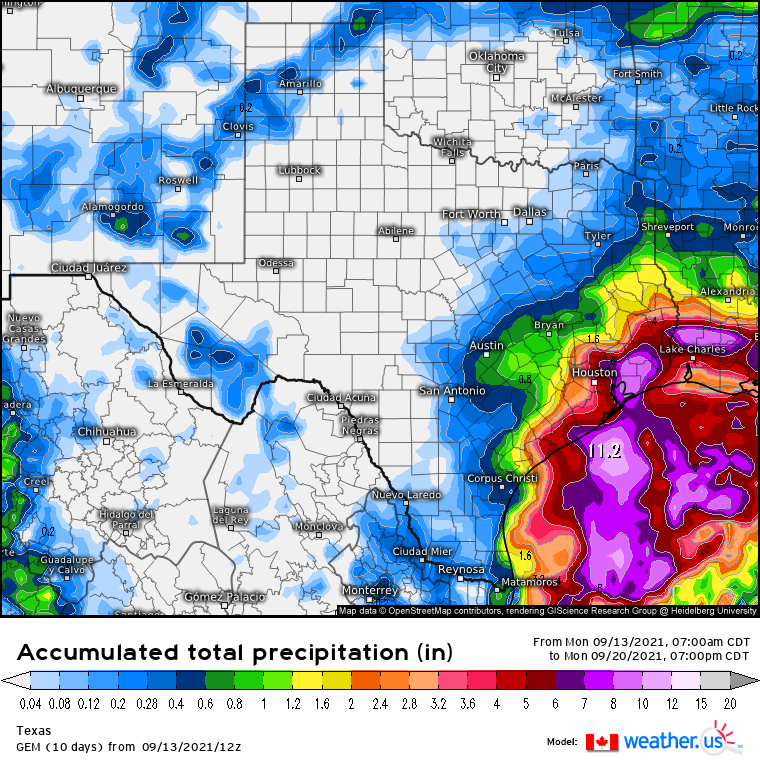
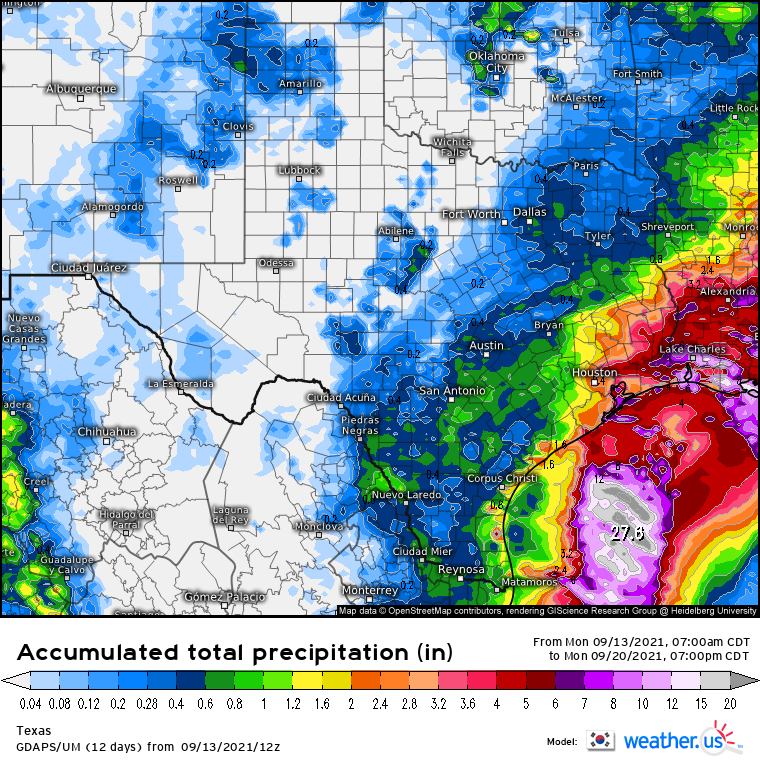
As with tropical systems, they often bring rain. How much rain will fall from future Harold? Here are rainfall forecast totals between August 21, 2023 to August 28, 2023. They are from Weather.US. The forecast models are: GFS (American) EURO (European) ICON (Germany) GDAPS/UM (South Korea) JMA (Japanese) GEM (Canadian) CMA (China)
The Korean has the highest amount of 19.70 inches of rain. The Japanese has the lowest amount of 4.80 inches. Quite a wide range forecast in terms of rainfall. I ran a statistical analysis using PSPP. I look at rainfall total forecast.
Mean
9.40
Median
7.50
Standard Deviation
5.00
95% Confidence Interval Lower Bound
4.78
95% Confidence Interval Upper Bound
14.02
The mean rainfall total is 9.40 inches with median of 7.50 inches. The 95% Confidence Interval range are from 4.78 inches to 14.02 inches. It is probable the rainfall total will be somewhere between 4 to 14 inches of rain. There is a five percent chance that it is not in the true mean. It means it could be below 4 inches or over 14 inches. I can say with 95% confidence that the rainfall total is probably going to be somewhere between 4 to 14 inches of rain. More than likely, it is over 4 inches of rain.
I suspect most areas will see between 1 to 3 inches of rain. Some areas could get over 6 inches. I would not rule out 12 inches or higher once it is all over. All the forecast models do have rain over Southeast Texas. The Japanese has the highest with 4 inches of rain in the next 7 days.
Here is what I think will happen. -Tropical Depression 9 will be Harold by morning. -Tropical Depression 9/Harold is likely to make landfall on South Texas. -Most areas in Texas will see rain.
An original post from 2013 that is reposted and changed.
It has been 40 years ago at this very moment that Hurricane Alicia ravaged Southeast Texas, centered in the Houston metropolitan area. Hurricane Alicia came during the Cold War between America and Soviet Union. The Cold War ended in 1991 and underwent change. The world changed with 9/11 and COVID Pandemic.
The winter of 1982-1983 was an extremely strong El Nino. It was the strongest prior to winter of 1997-1998. It is one reason why 1983 Hurricane Season was inactive because the Pacific was coming off of a strong El Nino. There was a tornado outbreak in the early morning hours of May 20, 1983. It would be the last major tornado outbreak in the Houston area until November 21, 1992. Summer of 1983 was a wet one. In early August, an unusual cold front passes Southeast Texas, setting off thunderstorms as warm and moist air clashes with cool and drier air. Once the cold front is over the Gulf of Mexico, a mesoscale convective system (MCS) forms near the coast of Alabama and Mississippi on August 14th. A MCS is a large area of thunderstorms with a center of low pressure.
The area of thunderstorms continues to persist that a low pressure system forms on August 15th. By 7:00 AM CST, the area of thunderstorms became Tropical Depression 3. It is unusual to see a tropical cyclone development from a frontal boundary in August. It is more likely to do so early or late in the season because cold fronts usually do not go into the Gulf of Mexico. Later that day, Tropical Depression 3 became Tropical Storm Alicia with 50 mph winds. It was strengthening due to favorable conditions. Also, Alicia was a relatively small storm and was in an area of higher ambient pressure. Alicia was moving slowly to the west-northwest towards Texas.
On August 17th, Alicia becomes the first hurricane of the 1983 season. It is slowly moving south-southwest of Galveston. Galveston has been hit by hurricanes in the past. It is also where the deadliest hurricane and natural disaster in American history, the Great Galveston Hurricane of 1900. It made landfall southwest of Galveston on September 8, 1900. It claimed 12,000 lives, which is more lives lost than the 1906 San Francisco Earthquake (6,000), September 11, 2001 Terrorist Attacks (3,000), and Hurricane Katrina (1,836) combined.
What is Galveston doing to prepare for the onslaught of Alicia? They are ordering people to evacuate and take cover on high ground. They evacuate to avoid storm surge produced by the hurricane. Before hand, when the National Hurricane Center (NHC) were issuing gale warnings and they were not taken seriously. Galveston Mayor E. Gus Manuel ordered an evacuation on storm surge vulnerable areas. Conditions begin to worsen in Galveston. By midnight of August 18th, Mayor Manuel orders a mandatory evacuation, which is by than too late. Bridges are inaccessible due to deteriorating weather condition in Galveston.
Alicia undergoes rapid intensification and becomes the first and only major hurricane of the 1983 season. It is getting ever so closer to Galveston. Waves are getting larger, storm surge is getting higher, wind is getting stronger, and rain is getting heavier. Alicia is getting close to make landfall. People who are trying to evacuate are realizing they made a huge mistake. Their complacency proved to be a decision they would regret. The last time, an evacuation was called was in August 1980 when Hurricane Allen was in the Gulf of Mexico. Allen was a Category 5 hurricane before it made landfall as a Category 3 hurricane in South Texas. Galvestonians thought they dodged a bullet again. They were proven very wrong. In some cases, it proved deadly.
A little after 1:00 AM, Alicia made landfall southwest of Galveston as a major hurricane. Galveston was getting hammered with strong winds, heavy rain, and storm surge. At landfall, Alicia was slightly larger than average. It had gale force winds extending up to 125 miles and hurricane force winds extending up to 60 miles from the eye. Alicia was not done with Texas. It was moving to the northwest towards the city of Houston. Everyone in Houston had hunkered down for Alicia. It was a very long night.
As Alicia moved further inland, it was weakening, but it did little to quell the fears of Houstonians. Houston was getting violently lashed by Alicia with heavy rain and strong winds. To make matter worse, tornadoes were spawned by Alicia. An area from Hobby Airport to Galveston were hammered by tornadoes. Power lines and transformers were getting blown away. Power outages were wide spread throughout the Houston area. By the time Alicia was over Downtown Houston, it had weakened to a borderline Tropical Storm/Category 1 hurricane. However, the winds were lashing Downtown Houston. The strong winds turned pebbles into bullets, which were on roofs of these at the time new skyscrapers. The pebbles damaged many windows on those downtown buildings. As Alicia progressed, it was weakening into a tropical storm and dumping heavy rain. There was widespread flooding in Southeast Texas from Alicia’s heavy rain. Many areas in the Houston area saw 6 to 10 inches of rain with isolated totals of 11 inches. This is flooding on top of storm surge that flooded coastal areas.
The next morning, people woke up to widespread damage from Alicia. Trees were knocked down, damaging houses, flooding streets, and no power. People are wondering what to do next, rebuild or not. To make matters worse, 21 people died from Alicia. All in all, Alicia did $2.6 billion dollars in damage, making it at the time, the most costliest hurricane in Texas. The name Alicia would be retired from the hurricane name list and be replaced with the name Allison.
Allison was first used in 1989 and it ravages Southeast Texas in the form of a tropical storm that dumps heavy rain. Also, it would ravage Central Louisiana, giving them record rainfall. However, that would not be the last time, Allison would visit Texas. In June of 2001, Tropical Storm Allison visits again and this time it proved to be catastrophic on June 8-9, 2001. Allison dumps extremely heavy rain over Houston and causes $5.5 billion in damages and claims 22 lives. As a result, Allison was retired and replaced with the name, Andrea.
Alicia would not be the last catastrophic hurricane to visit Houston-Galveston area. On September 13, 2008, Ike made landfall on Galveston. Ike was not as strong as Alicia in terms of wind, but was much larger, on the scale of Carla (1961) or Katrina (2005). Ike was extremely catastrophic for Texas and Louisiana, that it is the third most costliest hurricane, only Katrina and Sandy exceed Ike. 84 people in Texas lost their life from Ike and did a total of $37.5 billion in damages basin wide. Hurricane Harvey paid a visit to Texas in August 2017. Harvey dumped heavy rain over a large area. Many areas in Texas and Louisiana had 30 to 40 inches with amounts as high as 80 inches of rain! Harvey claimed a total of 103 lives and did $125 billion in damages. Harvey ties with Katrina as the costliest hurricane in America as of 2023.
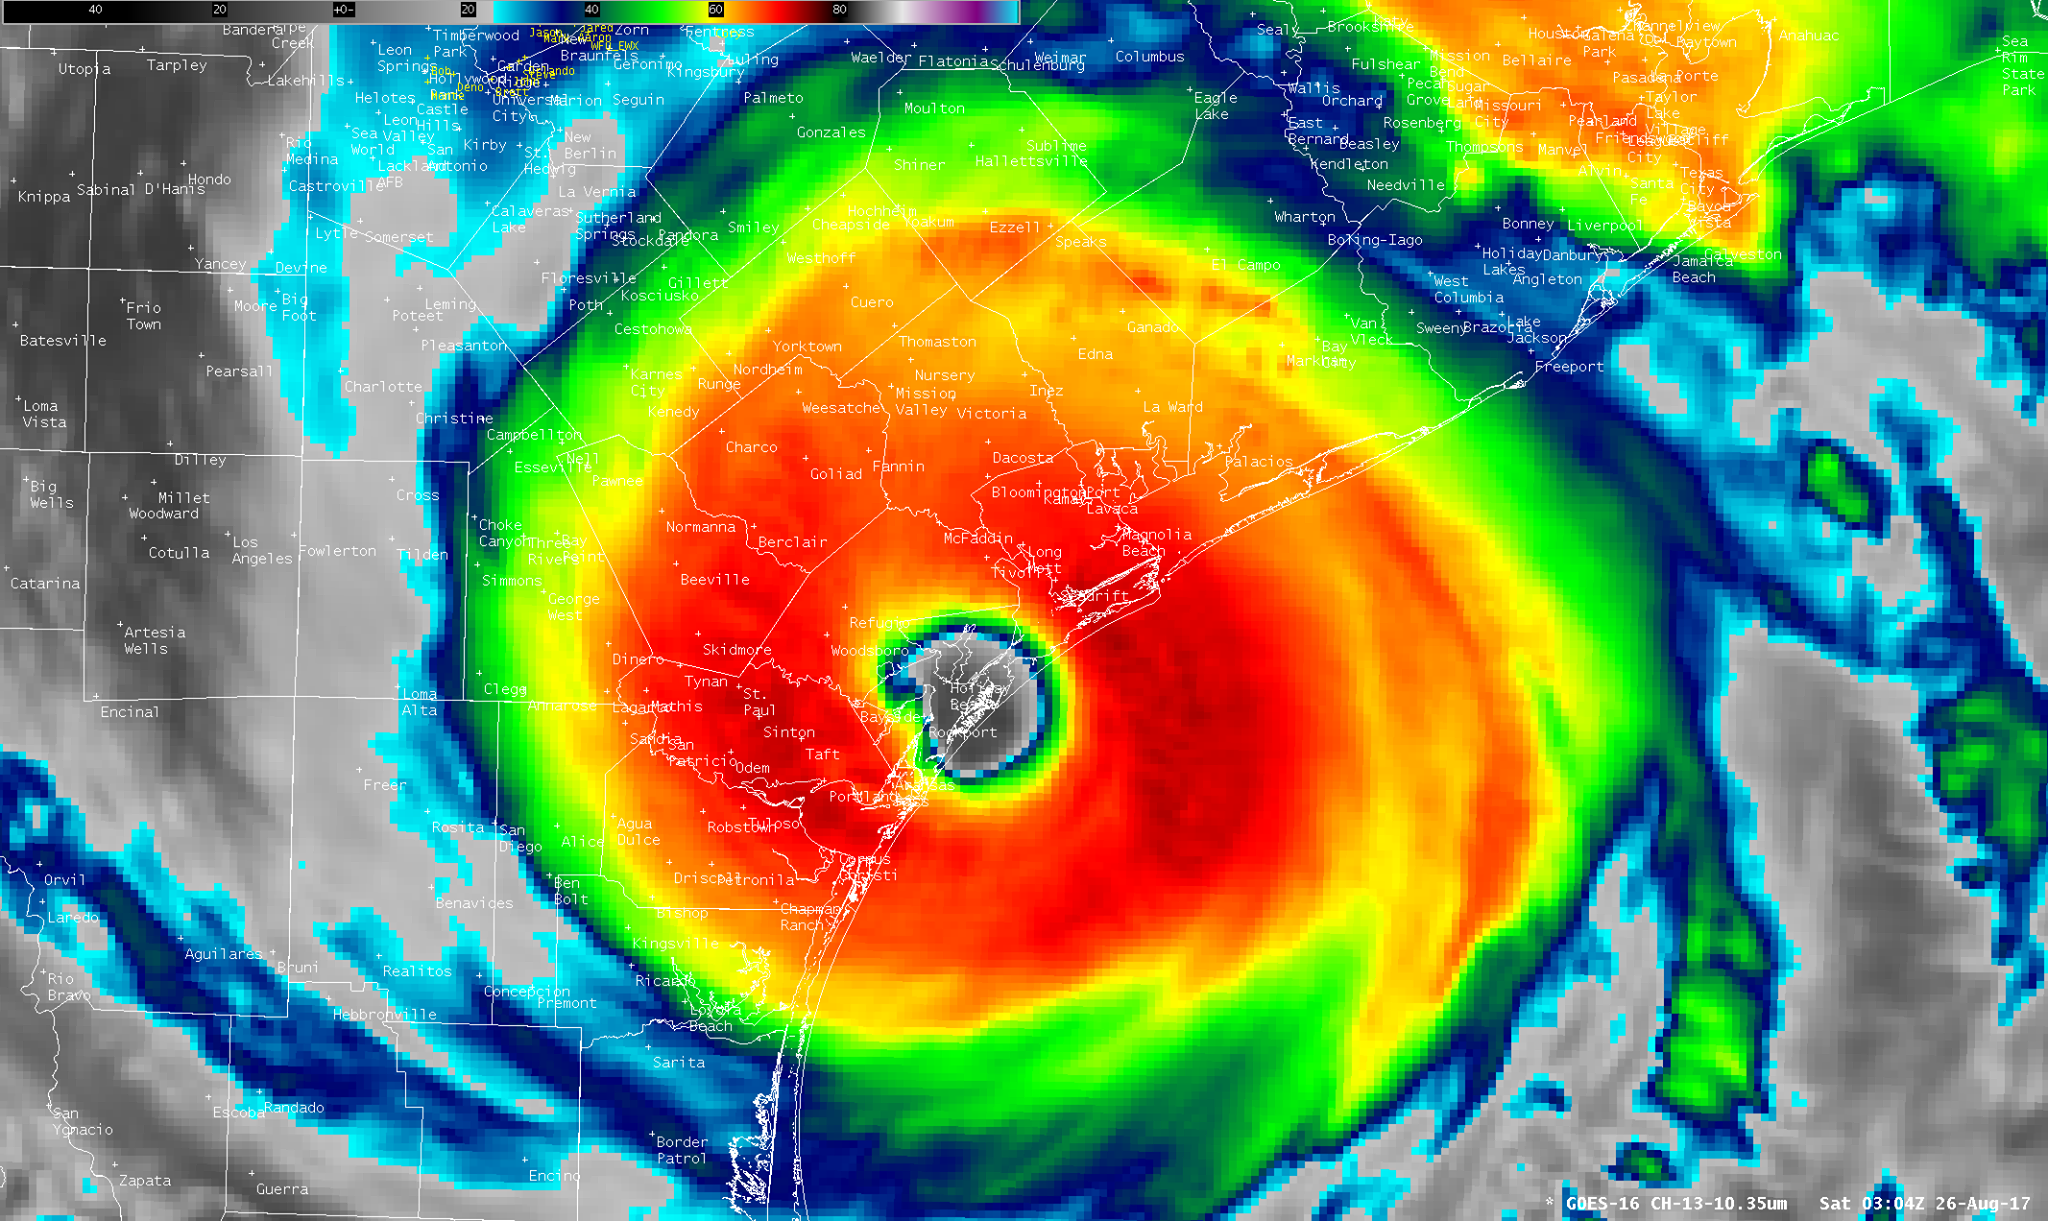
It is hard to believe, it has been five years since Hurricane Harvey made landfall near Port Aransas as a Category 4 hurricane with 130 mph winds. So much has happened since Harvey from COVID-19 Pandemic to Ukraine War. Harvey is the first major hurricane to make landfall on America since Wilma on October 24, 2005. Harvey made landfall on August 25, 2017. That is 43,23 days apart or 11 years, 10 months, 1 day or 142 months apart!
South Texas is hammered by strong wind, storm surge, and heavy rain. It packs a devastating punch. It is mainly along the coast in the Port Aransas area.
Once Harvey made landfall, it starts to weaken. Harvey is lingering over Texas. Large thunderstorms form near the center on the afternoon and evening of August 26, 2022. The large area of thunderstorms move toward Houston.
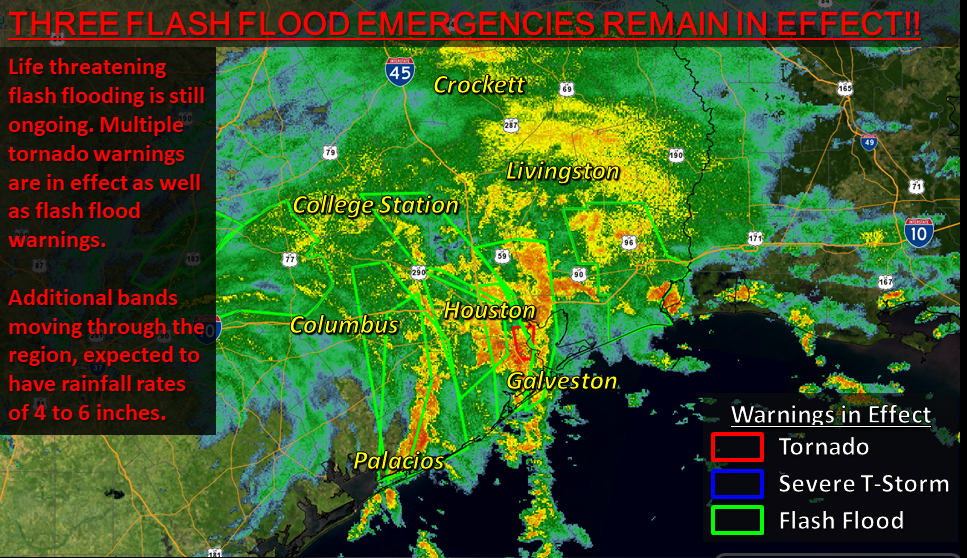
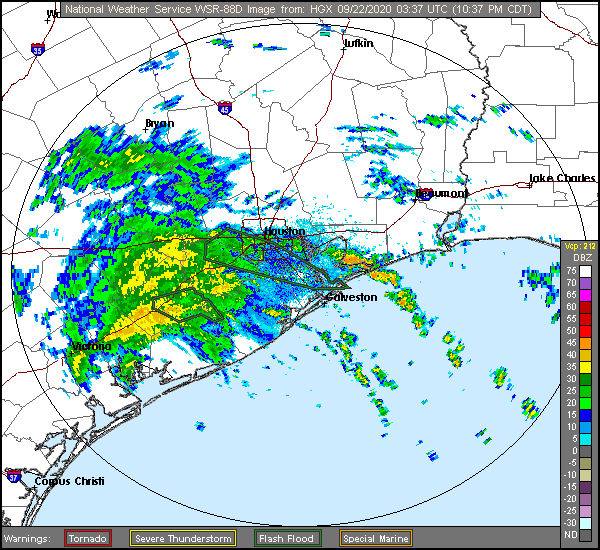
Doppler radar of Hurricane Harvey from National Weather Service.
The thunderstorms go over Houston area dumping heavy rain on the night of August 26, 2017 to the small hours of August 27, 2017. Heavy rain falls over and over on the Houston area.
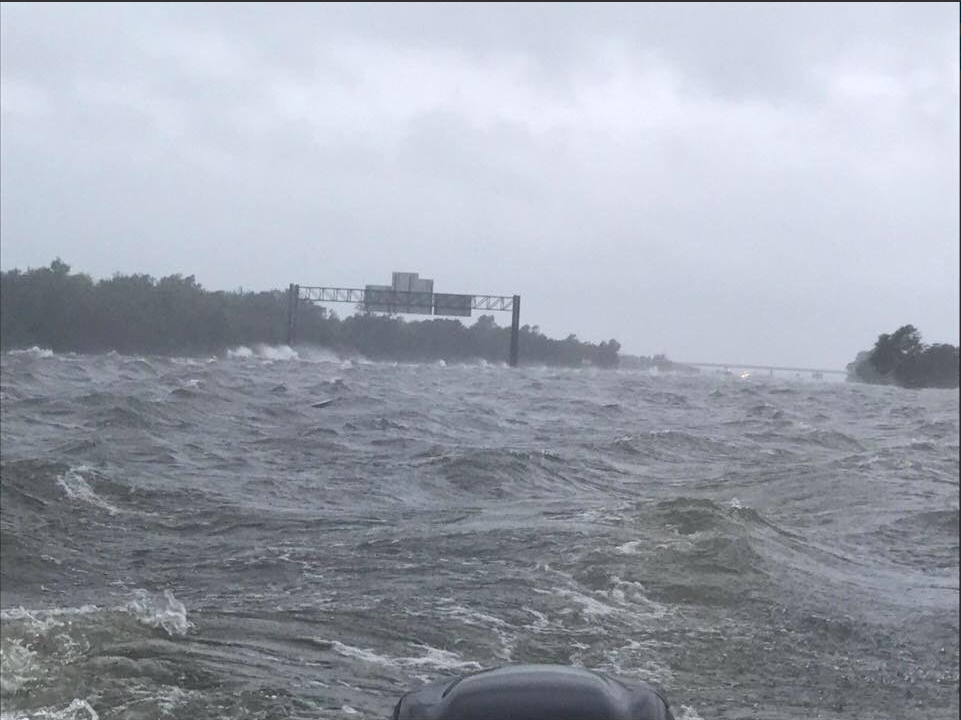
Houston area is flooded. Large areas receive 15 to 35 inches of rain from Harvey! Many houses and buildings are flooded as bayous and rivers are overflowing from heavy rain. Streets and freeways are flooded.
Heavy rain continues to ravage Southeast Texas as Harvey lingers over Texas. Then Harvey exits Texas and goes over the Gulf of Mexico. Heavy rain falls over East Texas. Beaumont gets over 31 inches of rain including over 26 inches in a single calendar day on August 29, 2017!
Many areas saw over 30 inches of rain from Harvey. The highest recorded is 60.58 inches of rain in Nederland. Some areas likely got over 60 inches of rain. A Personal Weather Station (PWS) in Baytown recorded over 66 inches of rain during Harvey from August 25-31, 2017. The August 2017 total for that station is over 74 inches! I would not be surprised if some areas got up to 80 inches of rain from Harvey.
Once Harvey passed, it did $125 billion in damage, which is comparable to Hurricane Katrina in 2005. 103 people lost their life from Harvey in Texas. It is the deadliest Texas hurricane since 1919. The 1919 Florida Keys hurricane claimed at least 284 lives in Texas. It is likely up to 1,000 people died. It is probable more people died during Harvey, but were not counted.
The headlines have been dominated by heat waves, wildfires, and floods. America is engulfed in a heat wave regardless of region. The heavy rain and floods claimed at least 37 lives in Eastern Kentucky. Eastern Kentucky has a heat wave on top of it. Northern California has been ravaged by wildfires. July 2022 has been the hottest on record for Houston. It eclipses July 1980, in which America was in midst of a heat wave. How does July 2022 compare for Houston and America? Let’s start with Houston.
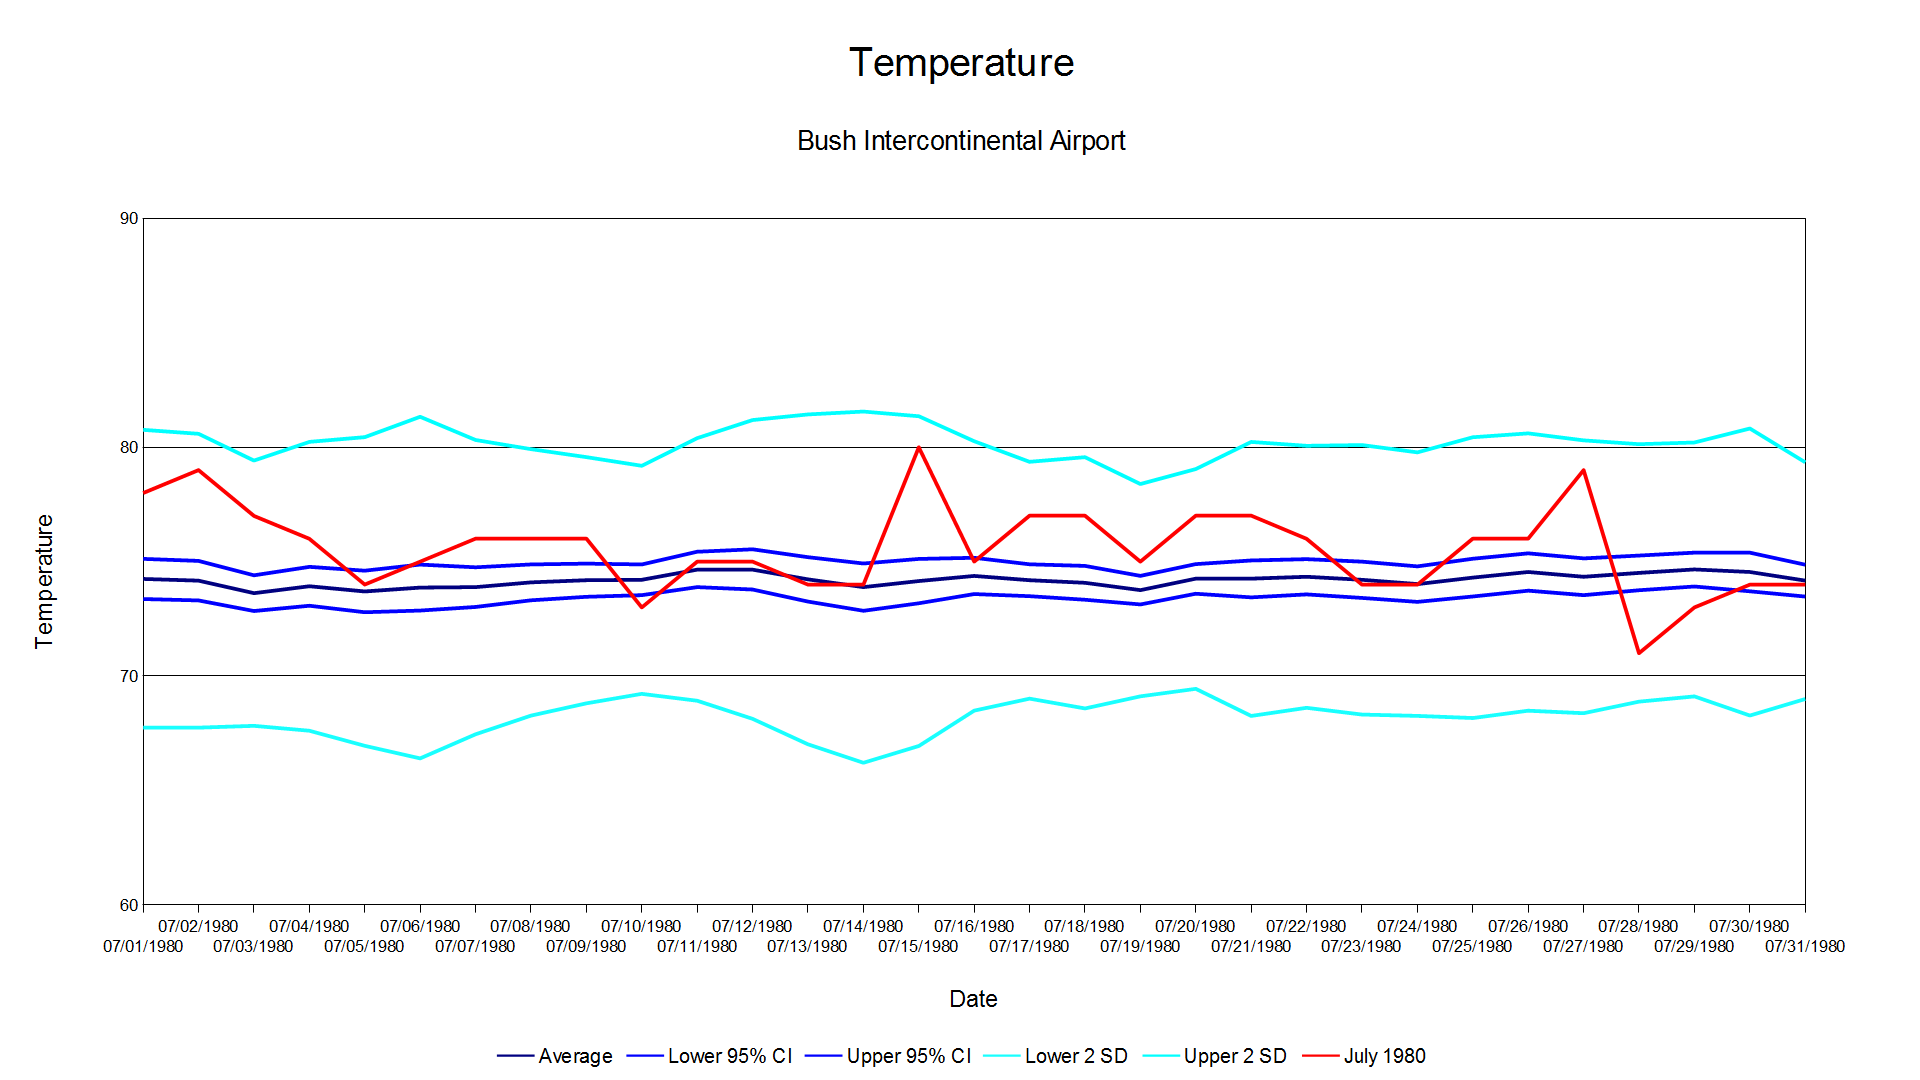
Here are charts of high, low, and average temperature for Houston, which is at Bush Intercontinental Airport. The data is from Global Historical Climatology Network – Daily (GHCN-Daily), Version 3. I calculated using JASP and generated graphs with Apache OpenOffice. The average and standard deviation are from 1969 to 2021. The charts have 95% Confidence Interval (CI), 2 Standard Deviations (2 SD) below and above, and actual temperature. Anything that is above or below 2 SD is considered unusual as it is 95% or greater to exceed the average or mean. Here is the high temperature for July 2022.
The hottest day was 105°F on July 10, 2022. It is the hottest July 10th recorded in Houston. It ties as the hottest July day on record in Houston with July 26, 1954. Houston recorded its hottest July 11th and 13th on record. There are days where July 2022 highs exceeded 2 SD. For the most part, the highs were within 2 SD. Certainly hot, but not extremely hot. Here is the low temperature for July 2022.
The low temperatures in July 2022 were likely to exceed 2 SD compared to high temperatures. There were often above average. There are no days where low temperature is below average. There are multiples days where lows exceeded 2 SD. The highest low temperatures recorded in Houston were on July 10-12 and July 18-20. They broke records for warmest low temperature recorded. The warm low temperatures contributed to July 2022 being warmest on record in Houston. Here is the average temperature for July 2022.
The average temperature exceeded 2 SD due to warm nights and days on July 10-12 and July 18-20. Let’s look at July 1980, the previous hottest July on record in Houston. Here is the high temperature for July 1980.
July 1980 highs were more likely to exceed 2 SD compared to July 2022. Many record July highs in Houston were set in July 1980. Texas and America were engulfed in a heat wave. The 1980 heat wave claimed at least 10,000 lives. The 1980 heat wave claimed more lives than 9/11, Hurricane Katrina or Hurricane Maria. July 1980 had more 100°F days than July 2022. July 1980 had 18 100°F days, while July 2022 had 13 100°F days. July 1980 is certainly hotter than July 2022 on that ground. Here is the low temperature for July 1980.
The low temperatures of July 1980 were within 2 SD. They were more likely to be within the average than July 2022. There were no record warm low temperatures set in July 1980, unlike in July 2022. There are some days in July 1980 that are below average. The low temperature is the reason why July 2022 is the warmest on record. If July 1980 had warm low temperatures of July 2022, it would easily exceed July 2022 as the warmest on record. Here is the average temperature for July 1980.
The average temperature exceeded 2 SD in July 1980. However, they are not on the level of July 2022 in terms of average temperature. July 1980 had normal low temperatures, while July 2022 had warm low temperatures, which kept things warm. Here is a 2 meter temperature anomaly of the Northern Hemisphere for July 2022. It includes America. It is from Daily Mean Composites.
It was certainly hot in America. It was also hot in Europe and East Asia. The cold weather are mostly in Russian Far East, Siberia, Central Asia, Alaska, and Northwest Canada. It was certainly hot in July 2022. Now, if you think July 2022 was really hot, try July 1936. Here is a 2 meter temperature anomaly of the Northern Hemisphere for July 1936. It is from 20th Century Reanalysis Daily Composites.
July 1936 was very hot in America. It was in midst of the Dust Bowl as there was the Great Depression. The Dust Bowl likely exacerbated the Great Depression as farmers suffered greatly. Many records were set in July 1936 and August 1936. The Summer of 1936 is the hottest on record for America. They are yet to be broken to this very day.
Texas’s hottest recorded day occurred on August 12, 1936 in Seymour. Seymour reached a high of 120°F. It also reached 120°F in Monahans on June 28, 1994. They are Texas’s highest recorded temperature and yet to be broken to this very day. Oklahoma’s hottest days (not a mistype as it happened more than once) recorded occurred four times in 1936 in Alva (July 18, 1936), Altus (July 19, 1936 and August 12, 1936), and Poteau (August 10, 1936) as they reached 120°F. They are yet to be broken in Oklahoma to this very day. North Dakota’s hottest recorded day occurred on July 6, 1936 in Steele with a high of 121°F. It is North Dakota’s hottest day recorded. It is yet to be broken to this very day for North Dakota. New York City’s hottest recorded day occurred on July 9, 1936 with a high of 106°F. It remains the hottest day recorded in New York City to this very day. The 1936 Annual Heat Wave Index in America is the highest. It easily exceeds 2022.
The death toll from the July 1936 heat wave is at least 5,000 people. There was a jump in mortality in 1936 compared to 1935. It suggests the heat wave claimed more than 5,000 lives directly and indirectly. America had over 128 million people in 1936. If the July 1936 heat wave happened today with the current population, the death toll would exceed at least 12,000 lives and likely higher.
July 2022 was certainly hot, but it does not come nowhere to July 1936. It was really hot back in 1936. People managed to survive as people did not have air conditioning. Few people had air conditioning in their homes. Some people slept outside at night as it was cooler outside than inside. I would not be surprised if there were heat waves comparable to and exceeding 1936 that occurred in the past.
It is hard to believe it has been thirteen years since Hurricane Ike made landfall on this day in Southeast Texas. It has been nearly a year since Tropical Storm Beta made landfall. Now, we have Tropical Storm Nicholas. The National Hurricane Center has Nicholas a near hurricane with 70 mph/110 km/h winds as of 7:00 PM CDT. Where does Nicholas go and will it stall over Texas? Here is the forecast model from National Center for Atmospheric Research (NCAR). It is a heat map generated by QGIS. The heat map use points within 300 mile/480 kilometers radius. I used the latest forecast, which is 1800Z.
The heat map is not as circular, as it is more oval. A more circular heat would suggest that Nicholas could linger over Texas. However, it looks more likely Nicholas will exit Texas. Nicholas is not going to be another Harvey at this time. That is a good thing as Harvey dumped heavy rain over Southeast Texas for nearly a week. The next question is how strong will Nicholas be before landfall.
Most intensity forecast models keep Nicholas as a tropical storm. One has it near hurricane. Intensity forecast models are not reliable. I think Nicholas could further intensify into a hurricane before landfall. I would not be surprised if Nicholas makes landfall with 75 to 80 mph (120 to 128 km/h) winds. The most concerning aspect is the rainfall from Nicholas. Southeast Texas had string of floods from Memorial Day 2015, Tax Day 2016, Memorial Day 2016, Harvey, and Imelda. Here are forecast models of rainfall totals. The forecast models are from Weather.US. They are all seven day rainfall total forecast.
The forecast modes are: EURO (European) ICON (German) GFS (American) GEM (Canadian) CMA (China) UM (South Korea)
EUROICONGFSGEMCMAUM
The Korean forecast model has the highest rainfall total of over 27 inches of rain. The EURO has over 16 inches of rain. Most forecast models have between 10 to 11 inches of rain. The forecast models are all over the place where the heaviest rain will fall. Some have it off shore, while some have it over land. I ran a statistical analysis using PSPP. The forecast are from highest rainfall totals in the forecast models.
The mean is 14.85 inches and median is 11.55 inches. The 95% Confidence Interval range are from 7.92 to 21.78 inches. It is probable the highest amount is somewhere between 8 to 21 inches of rain. There is a five percent chance that it is not in the true mean. It means it could be less than 8 inches or over 21 inches. I can say with 95% confidence that the the highest rainfall total will probably be somewhere between 8 to 22 inches with the mean of 15 inches. I would not be surprised if some areas have nearly 25 inches of rain before it is all over.
Here is what I think will happen. -Nicholas could further intensify into a Category 1 hurricane before landfall. -Rainfall amounts could range from 10 to 15 inches/25.4 to 38.1 centimeters of rain with isolated totals approaching 25 inches/63.5 centimeters. -Some areas could see flooding.
It is looking likely it is going to get very cold next week. This comes during the COVID-19 pandemic. If you want to read more about the coronavirus, check my other blog, The Ebola Zone.
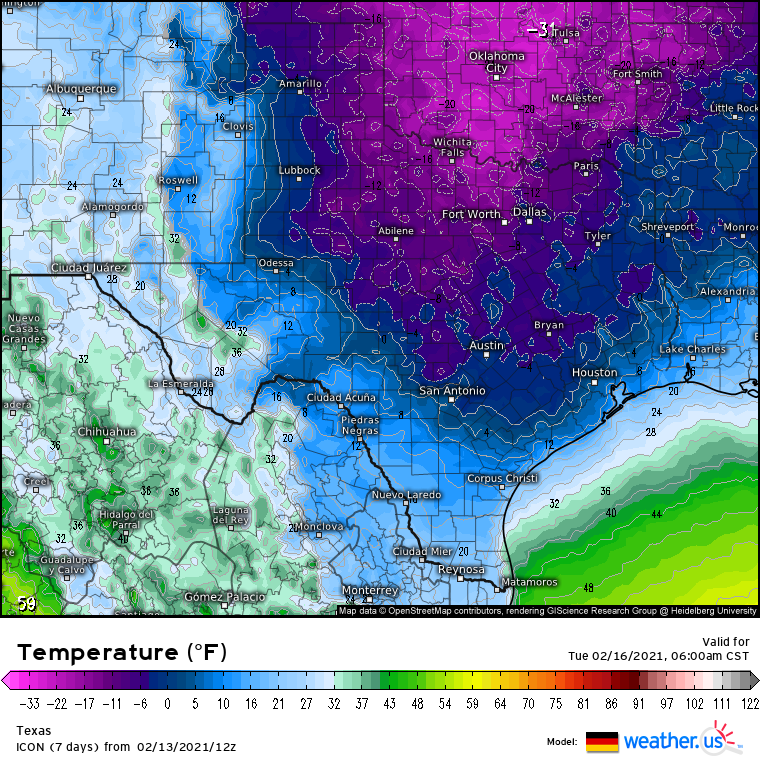
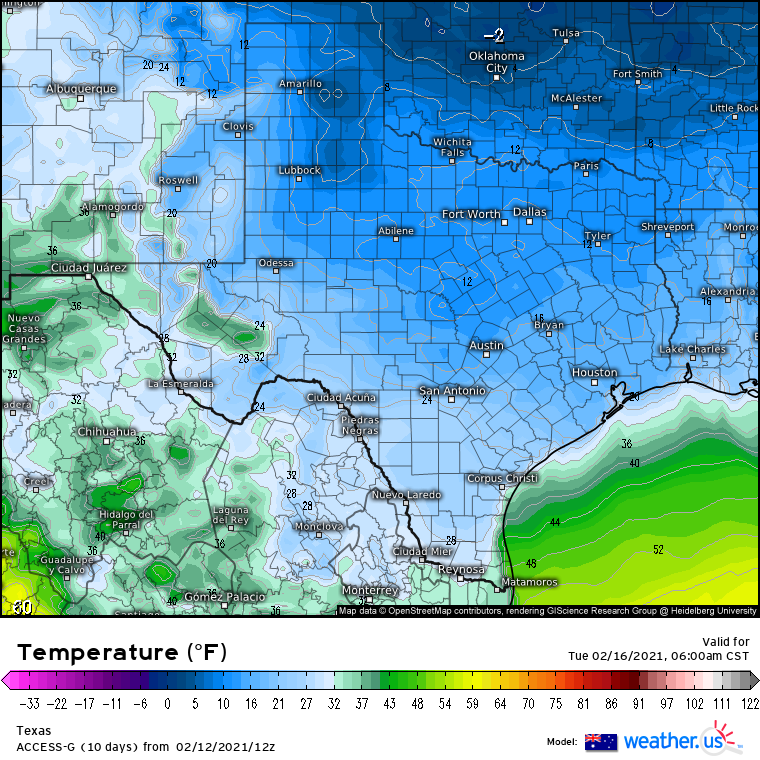
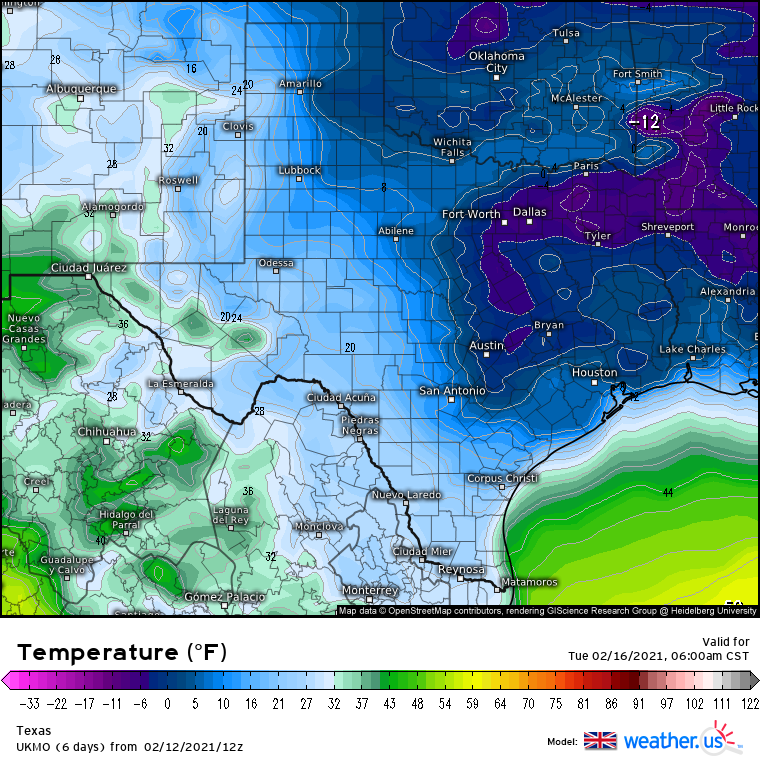
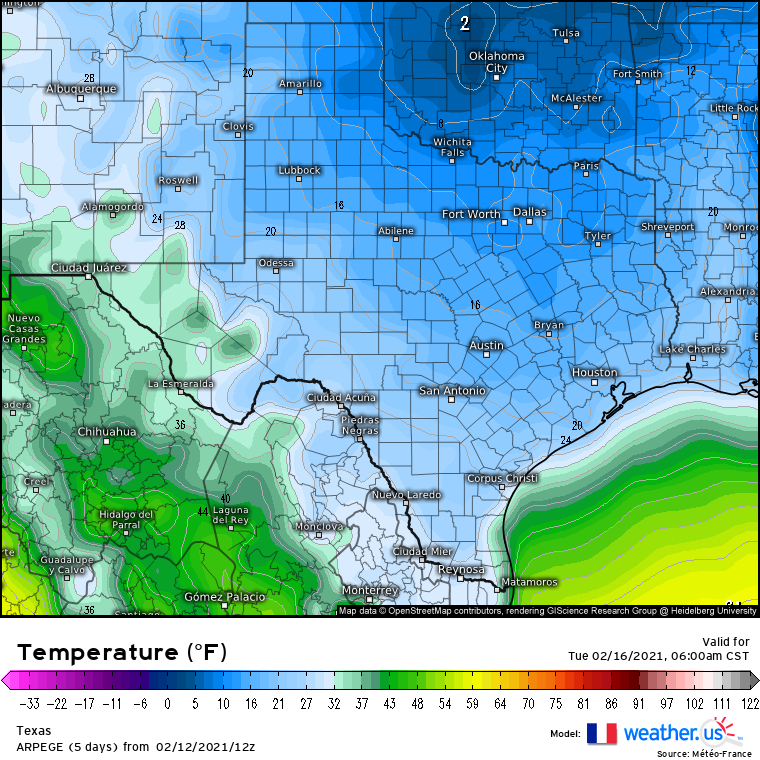
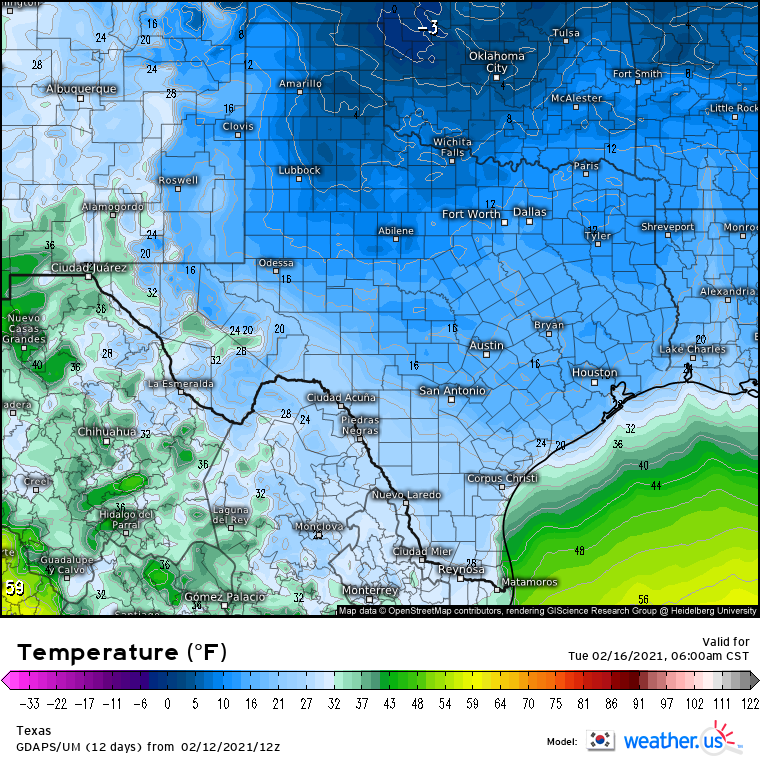
The forecast models are all over the place of how low it will go. Same goes with snowfall forecast. The consensus is the lowest temperature will be on Tuesday. The temperature is in Fahrenheit. Here are forecast models from Weather.US. They are all at 6:00 AM on February 16, 2021.
The forecast modes are: EURO (European) ICON (German) GFS (American) GEM (Canadian) ACCESS-G (Australia) UK (United Kingdom) ARPEGE (France) CMA (China) GDAPS/UM (South Korea)
EUROICONGFSCMCACCESS-GUKARPEGECMAGDAPS/UM
The ICON, Canadian, and UK have the coldest temperature. The UK forecasts below zero in Houston! That would be a record low if that is the case! The lowest temperature recorded in Houston is 5°F on January 18, 1930. It is likely Houston has seen subzero temperature, but not recorded. It could of happened during solar minimum. Solar minimum is when sunspot activity is low. It could also happen after a major volcanic eruption. The CMA has a relatively balmy 20s as lows. That is the highest forecast low.
I ran a statistical analysis using PSPP. The forecast lows are from forecast models for Houston.
The mean low is around 12°F and median low is 16°F. The 95% Confidence Interval range are from 5.93°F to 18.74°F. The mean and standard deviation is lower from yesterday. It is probable the low will be somewhere between 6°F to 19°F. There is a five percent chance that it is not in the true mean. It means it could be sub zero or above freezing. I can say with 95% confidence that the low is probably going to be somewhere between 6°F to 19°F with the mean at 12°F.
Wintry precipitation and snowfall is looking more likely for Texas. Here is the snowfall forecast models and are in inches. It is by 6:00 AM on February 16, 2021.
They are: EURO (European) ICON (German) GFS (American) GEM (Canadian) UK (United Kingdom)
EUROICONGFSGEMUK
The ICON and GFS are bullish in terms of snowfall amounts for Texas. The GFS has 16 inches of snow near Bryan-College Station. Just northwest of Houston, GFS has nearly 10 inches of snowfall. The GEM and UK have lower snowfall amounts. The UK has the lowest snowfall amount overall for Texas. However, UK has higher snowfall amounts for Southeast Texas.
I ran a statistical analysis using PSPP. The snowfall forecast totals are from forecast models for Houston.
The mean snowfall total is 2.24 inches and median snowfall total is 2.00 inches. The 95% Confidence Interval range are from 0.94 to 3.54 inches. It is probable the snowfall amount is between 0.90 to 3.50 inches. There is a five percent chance that it is not in the true mean. It means there could be no snowfall or epic snowfall (think February 14-15, 1895 snowfall). I can say with 95% confidence that the snowfall amount is probably going to be somewhere between 0.90 to 3.50 inches with the mean at 2.20 inches. I would not be surprised if we see higher snowfall amounts.
Based on the forecast models, my forecast for lows on February 16, 2012 is going to be somewhere between 6°F to 18°F. Snowfall amount forecast is somewhere between 0.50 to 3.50 inches. The forecast depends on where you are.
The forecasts models are subject to change. It will likely change again.
It is getting cold across America including Texas. It comes at a time when the world is ravaged by the coronavirus. If you want to read more about the pandemic, head over to my other blog, The Ebola Zone.
The forecast models are all over the place of how low it will go. The consensus is the lowest temperature will be on Tuesday. Here are forecast models from Weather.US. They diverge on how low it will go at 6:00 AM on February 16, 2021.
The forecast modes are: EURO (European) ICON (German) GFS (American) GEM (Canadian) ACCESS-G (Australia) UK (United Kingdom) ARPEGE (France) CMA (China) GDAPS/UM (South Korea)
EUROICONGFSGEMACCESS-GUKARPEGECMAGDAPS/UM
The ICON, Canadian, and UK have the coldest temperature. They forecast single digit lows in Houston! ICON has parts of Oklahoma hitting a low of -29°F! The CMA has a relatively balmy 20s as lows. That is the highest forecast low.
I ran a statistical analysis using JASP. The forecast lows are from forecast models for Houston.
The mean low is around 14°F and median low is 16°F. The 95% Confidence Interval range are from 9.6°F to 19.04°F. It is probable the low will be somewhere between 9°F to 19°F. There is a five percent chance that it is not in the true mean. It means it could be close to 0°F or above freezing. I can say with 95% confidence that the low is probably going to be somewhere between 9°F to 19°F with the mean at 14°F.
The UK forecast model low would tie with February 1899 lows. There was an epic cold blast that engulfed America. Houston had lows of 6°F back to back! The back to back lows were on February 12 and February 13, 1899. It is truly a freeze that is yet to be seen again since then. The closest being December 1989, which Houston had a low of 7°F on December 23, 1989! It is likely Houston had single digit lows in the January 1886 cold blast. Prior to 1886, it is likely Houston had cold blasts in single digits and even sub zero lows! This would of occurred before weather was measured.
The forecast lows are subject to change. It will likely change again come tomorrow.
Tropical Storm Beta has made landfall sometimes around 10:00 PM CDT. As of 11:00 PM CDT, Beta has 45 mph winds. It is from the National Hurricane Center (NHC).
000
WTNT62 KNHC 220401
TCUAT2
Tropical Storm Beta Tropical Cyclone Update
NWS National Hurricane Center Miami FL AL222020
1100 PM CDT Mon Sep 21 2020
…CENTER OF BETA CROSSES THE TEXAS COAST NEAR THE SOUTHERN END OF
MATAGORDA PENINSULA…
Surface observations received after the issuance of the previous
advisory indicate that Beta’s center crossed the Texas coast near
the southern end of Matagorda Peninsula around 10 PM CDT.
SUMMARY OF 1100 PM CDT…0400 UTC…INFORMATION
———————————————-
LOCATION…28.5N 96.4W
ABOUT 5 MI…10 KM N OF PORT OCONNOR TEXAS
ABOUT 25 MI…40 KM WSW OF MATAGORDA TEXAS
MAXIMUM SUSTAINED WINDS…45 MPH…75 KM/H
PRESENT MOVEMENT…NW OR 325 DEGREES AT 3 MPH…6 KM/H
MINIMUM CENTRAL PRESSURE…999 MB…29.50 INCHES
$$
Forecaster Berg
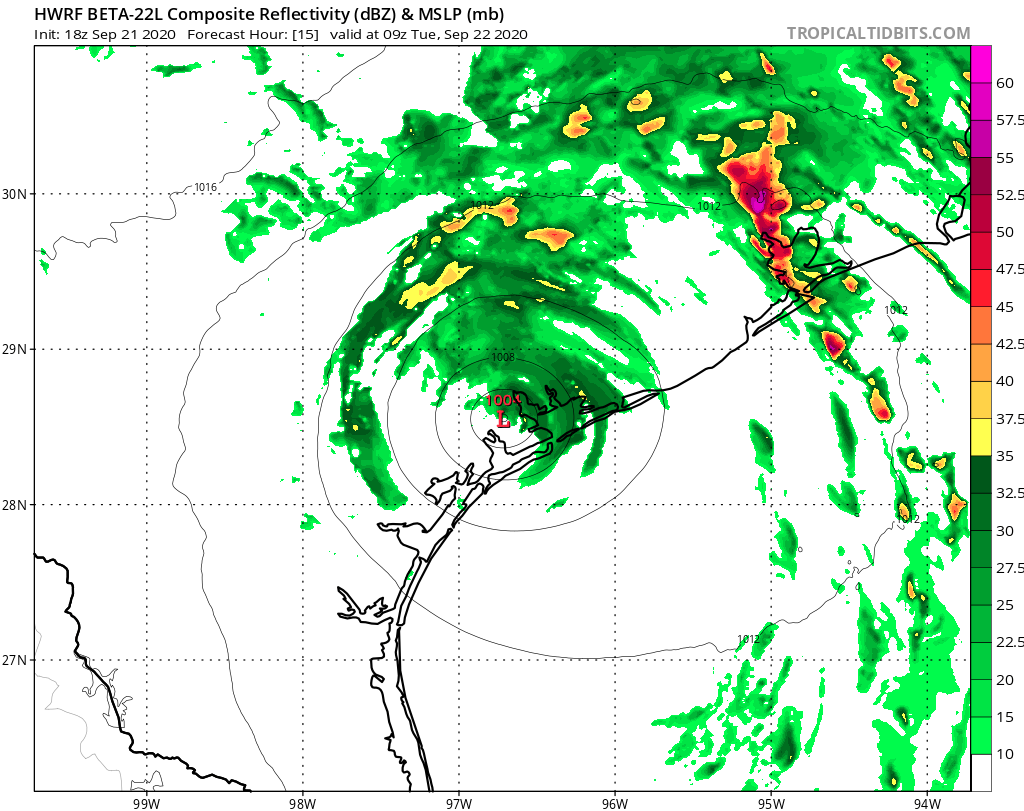
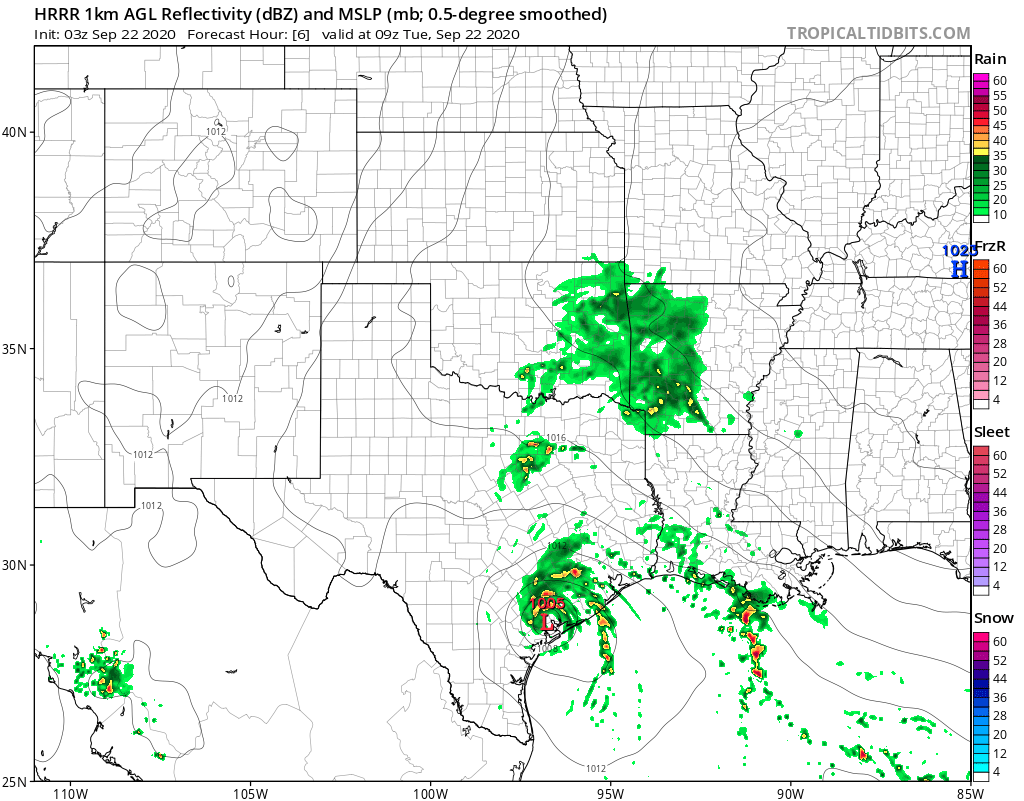
Many are wondering what will Beta do later tonight as it is a slow mover. Here are some forecast models from Tropical Tidbits. The forecast models are Hurricane Weather Research and Forecasting (HWRF), High-Resolution Rapid Refresh (HRRR), North American Mesoscale Forecast System (NAM), Regional Model (RGEM), and Weather Research and Forecast (WRF-ARW2). They are at 0900Z or 4:00 AM CDT.
HWRF
HRRR
NAM
RGEM
WRF-ARW2
HWRF and RGEM have heavy rain around 4:00 AM near the center. HRRR, NAM, and WRF-ARW2 do not forecast feeder bands near the center at 4:00 AM. HRRR, NAM, and WRF-ARW2 have more scattered rainfall instead of the more organized thunderstorms that HWRF and RGEM forecasts. With tropical systems or any warm core low pressure, they tend to have thunderstorms and heavy rain near the center at night. They can dump heavy rain over a short time and lead to flooding. It is more so when they are slow moving.
Regardless of those forecast models, I would not be surprised if we see core rains tonight. I do not know where it will happen. It will likely happen on the northeast side of Beta. There could be surprises. Core rains are notoriously difficult to forecast. Tomorrow could be problematic as Beta is likely to linger over Southeast Texas. I would be most concern of tonight and tomorrow night.