Some of the weather data for Houston and Anchorage are missing. Houston weather data is at the Houston Weather Bureau in Downtown Houston and Bush Intercontinental Airport starting in 1969. New York City weather data is at Central Park. Anchorage weather data is at Merrill Field. All temperatures are in Fahrenheit. Let’s start with Houston.
Houston’s Record Low For Christmas By Year
Year
Temperature
1983
11
1989
20
1990
26
1924
27
1985
29
1898/1978/1980
30
1921/1998
31
1996/2002/2004/2009
32
1900/1918/1926/1953/1979/1981/1993/2001/2007
33
1920/1947/1972/1994/2014
34
The coldest Christmas recorded in Houston occurred in 1983. It reached a low of 11°F. The next coldest is in 1989. It reached a low of 30°F in 1898, 1978, and 1980. It can get cold on Christmas in Houston. There was a White Christmas in Houston in 2004. It is likely Houston has seen snow on Christmas before 2004 and went unrecorded. Let’s look at New York City.
New York City’s Record Low For Christmas By Year
Year
Temperature
1980
-1
1872/1983
4
1914
11
1958
12
1878/1948/1968
13
1969/1989
14
1870/1876/1896/1924/2000
15
1884/1919/1927
16
1890/1897/1906/1935/1975/1992
17
1892
18
The coldest Christmas recorded in New York City occurred in 1980. It reached a low of -1°F. The next coldest were in 1872 and 1983. New York City has had White Christmas in the past. The last time there was a White Christmas was in 2009. It is not a common occurrence to have White Christmas in New York City. Houston and New York City were cold in 1924, 1980, 1983, and 1989. Let’s look at Anchorage.
Anchorage’s Record Low For Christmas By Year
Year
Temperature
1917
-36
1949
-25
1942
-16
2013
-13
1938
-11
1933/1951
-10
1937/2011
-9
1932
-8
2003
-7
2004/2010
-3
The coldest Christmas recorded in Anchorage occurred in 1917. It reached a low of -36°F. Talk about a bone chilling Christmas! The next coldest occurred in 1949. Anchorage is likely to have a White Christmas. If one wants a White Christmas, go to Alaska. There is plenty of snow on the ground and it is cold. If the cold air is in Alaska and Arctic region, it is likely to be warm in the Lower 48. In some cases, the cold air finds its way into the Lower 48.
In 1917, Alaska and Arctic region were very cold. The Lower 48 was quite warm. The December 1983 cold blast affected almost every area of the Lower 48, except for the Southwest and Florida. The December 1989 cold blast was east of the Rocky Mountains. West of the Rocky Mountains was warm. Florida got very cold in 1989. It shows cold blasts are not the same. Some areas are cold, while other areas are warm.
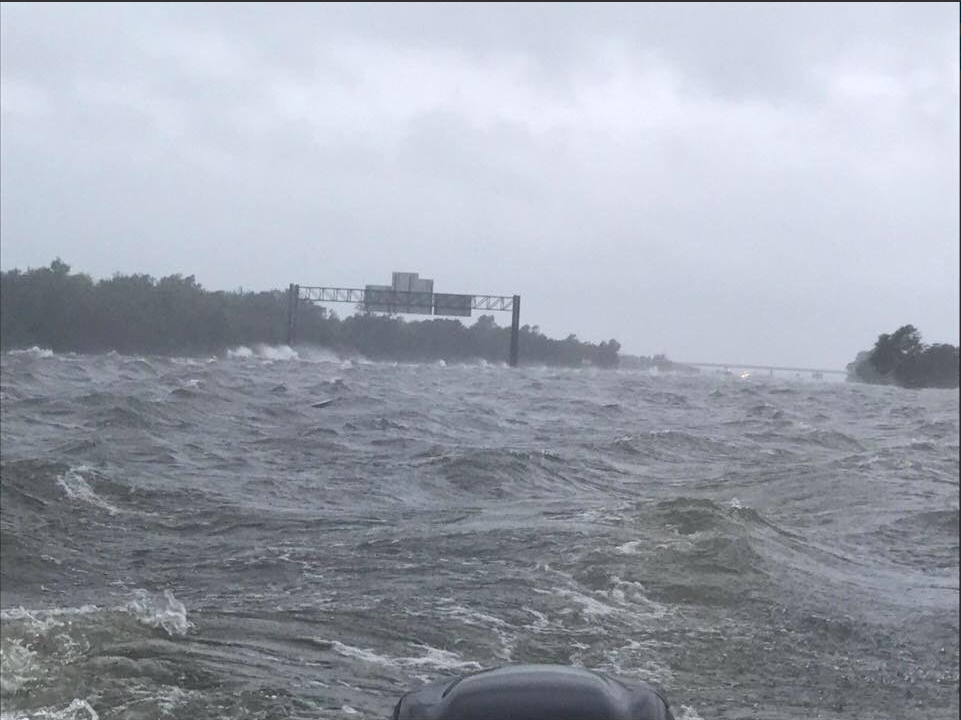
The magnitude of destruction from Hurricane Ian has come to light. The monster storm surge and strong winds ravaged Southwest Florida. It is nothing short of utter devastation for Southwest Florida. Fort Myers is utterly flattened. It looks like a war zone. Houses and buildings are flattened everywhere. The damage total is likely to be in the hundreds of billions of dollars.
Joe Raedle – Getty Images
The death toll is something I do not want to think about at this time. At least 10 people are known to have died. Lee County Sheriff Carmine Marceno thinks the death toll could be in the hundreds. The full extent is not even known yet. I would not be surprised if the death toll rises from Hurricane Ian.
Hurricane Ian is a Category 1 hurricane with 85 mph winds from the National Hurricane Center (NHC) as of 11:15 PM EDT. It is quite a large storm with tropical storm force extending up to 415 miles. Here is the most recent forecast model for where Ian will go. The forecast model is from National Center for Atmospheric Research (NCAR). It is a heat map generated by QGIS. The heat map use points within 300 mile/480 kilometers radius. I used the latest forecast, which is at 0000Z.
Most forecast models have Hurricane Ian making landfall in South Carolina. North Carolina should not let their guard down. Currently, South Carolina and North Carolina are experiencing tropical storm force winds. It is going to be a rough night and Friday for them. Could Ian further intensify before it makes landfall? Here is an intensity forecast model from NCAR.
Most forecast models keep Hurricane Ian as a Category 1 hurricane. I would not be surprised if Ian further intensifies. A Category 2 hurricane is not out of question for Ian. Coastal South Carolina is prone to storm surge. Hurricane Hugo ravaged South Carolina with storm surge as high as 20 feet in 1989. Hugo made landfall as a large Category 4 hurricane. I do not think Ian will be a major hurricane at this time.
Here is what I think will happen. -Ian is likely to further intensify, possibly up to Category 2 hurricane. -Storm surge will be the main threat for South Carolina. -Heavy rain and flooding will be another threat.
I am going to leave you with this image. It is a scene that is being repeated all over Southwest Florida. It will likely be the case in South Carolina, North Carolina, and Virginia.
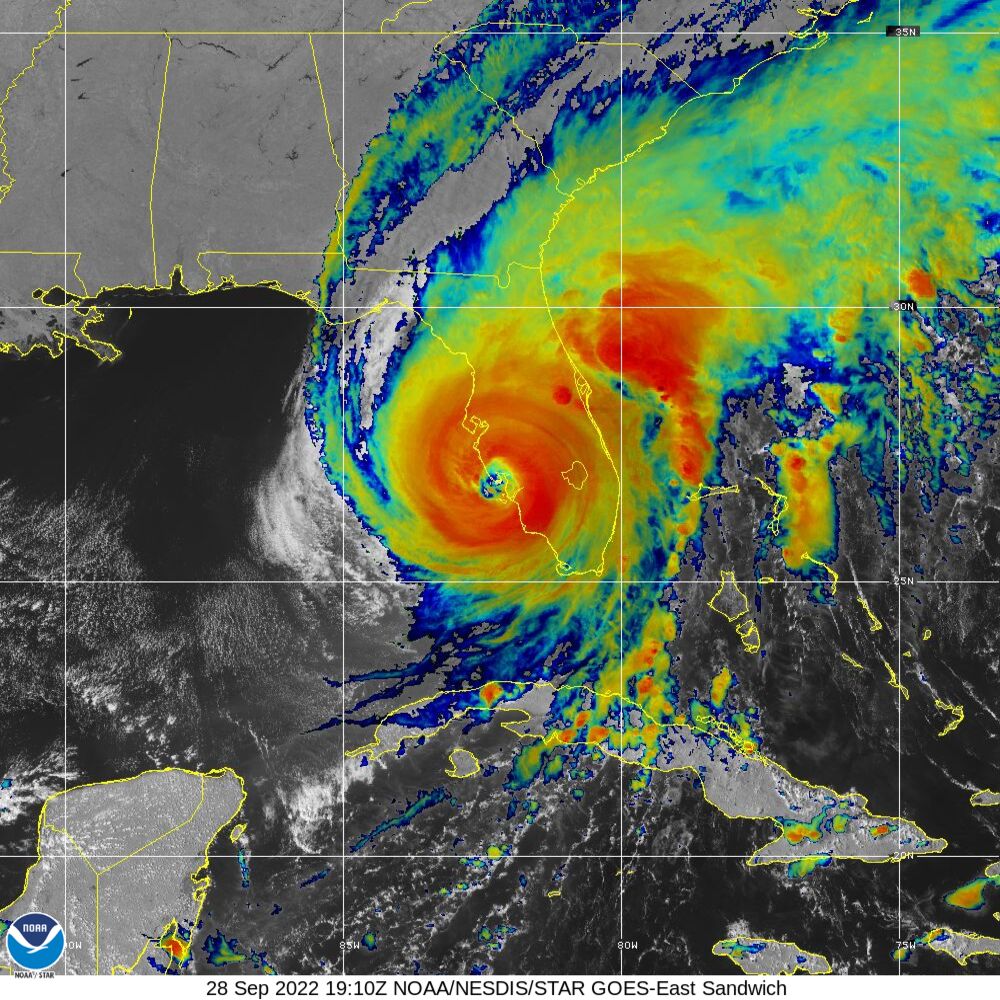
Hurricane Ian made landfall at 3:05 PM EDT on Cayo Costa and near Pirate Harbor at around at 4:35 PM EDT. Hurricane Ian made landfall as a Category 4 hurricane with 150 mph winds at Cayo Costa. Ian peaked at 155 mph winds and central pressure of 936 millibars. I would not be surprised if Ian gets upgraded to Category 5. Hurricane Ian gives a sense of deja vu with Hurricane Charley. Hurricane Charley made landfall on August 13, 2004.
Hurricane Charley made landfall at the almost same location where Hurricane Ian did. Even the landfall times are almost the same at 3:45 PM and 4:45 PM. Both had frontal boundary that impacted steering motion for them. Talk about eerily similar. However, there are differences between Charley and Ian.
Hurricane Ian is stronger with 155 mph winds and central pressure of 936 millibars at peak. Hurricane Charley peaked at 150 mph and 941 millibars. Charley is much smaller with hurricane force winds extending up to 25 miles from the eye. Tropical storm force winds extend up to 85 miles for Charley. Ian has hurricane force winds extending up to 45 miles from the eye. Ian has large tropical storm force winds extending up to 175 miles. Charley moved faster compared to Ian. The storm surge is much higher in Ian than in Charley. In terms of rain amount, Charley dumped 4 to 8 inches of rain. Ian has dumped over 12 inches of rain and still falling as of tonight (September 28, 2022). Charley is not a flood event, while Ian is looking to be a flood event.
Here are rainfall forecast totals between September 28, 2022 to October 6, 2022. They are from Weather.US. The forecast models are: GFS (American) EURO (European) GDAPS/UM (South Korea) GEM (Canadian) CMA (China)
GFS (American)EURO (European)GDAPS/UM (South Korean)GEM (Canadian)CMA (Chinese)
The Canadian has the lowest amount of 16.80 inches of rain. The Korean has the highest at 42.20 inches of rain. I ran a statistical analysis using PSPP. I look at rainfall total forecast.
Mean
24.92
Median
20.4
Standard Deviation
10.51
95% Confidence Interval Lower Bound
11.87
95% Confidence Interval Upper Bound
37.97
The mean rainfall total is 24.92 inches with median of 20.40 inches. The 95% Confidence Interval range are from 11.87 inches to 37.97 inches. It is probable the rainfall total will be somewhere between 12 to 38 inches of rain. There is a five percent chance that it is not in the true mean. It means it could be below 12 inches or over 50 inches. I can say with 95% confidence that the rainfall total is probably going to be somewhere between 12 to 38 inches of rain. More than likely, it is now over 12 inches of rain.
I would not be surprised if some areas in Florida see over 40 inches of rain from Hurricane Ian. If Hurricane Ian was to dump 40 inches or greater, that would be a record for Florida. The highest known 24 hour rainfall total for Florida is 38.70 inches in Yankeetown! The total rainfall from Easy is 45.20 inches, making it Florida’s wettest tropical system. It is probable some areas could of had higher rainfall totals from Easy. Ian could challenge Easy in terms of rainfall.
Here is what I think will happen. -Ian is likely to weaken overnight. -Ian is likely to be more of a heavy rain even for inland and East Coast of Florda. -Storm surge will remain a problem for Florida.
Hurricane Ian has passed Cuba. It made landfall at around 4:30 AM Eastern Time in the Pinar del Rio province as a Category 3 hurricane with 125 mph winds. The highest wind on land is around 106 mph with gusts of 160 to 175 mph. The hurricane overwhelmed the Cuban power grid, which caused it to collapse. All of Cuba is out of power as of tonight. No words on casualties yet in Cuba.
The National Hurricane Center (NHC) has the eye of Hurricane Ian is over Dry Tortuga as of 10:00 PM Eastern Time. It is a Category 3 hurricane with 120 mph winds and central pressure of 947 millibars. Where does Ian go? Here is the forecast model from National Center for Atmospheric Research (NCAR). It is a heat map generated by QGIS. The heat map use points within 300 mile/480 kilometers radius. I used the latest forecast, which is at 0000Z.
Most forecast models have a southward trend compared to yesterday’s forecast model. It look like Tampa Bay was in the bull’s eye.
Hurricane Ian could make landfall south of Tampa Bay. That does not mean Tampa Bay is out of the woods yet. Forecast models are subject to change. Ian could make landfall between north to south of Tampa Bay. As Ian remains over the Gulf of Mexico, how strong will Ian be before it makes landfall? It is also from NCAR.
Most forecast models keep Ian as a Category 3 hurricane with one having it as a Category 4 hurricane. I would not be surprised if Ian intensifies again as strong as Category 5 hurricane. I think it will likely be a Category 4 hurricane with winds of 150 mph. It will likely make landfall somewhere along the Florida as a Category 3 or 4 hurricane.
The infrared simulation has a large Hurricane Ian that has intensified. It is interacting with the cold front. The Doppler radar simulation has a central pressure of 945 millibars with winds of around 125 mph. Here is a wind speed of Hurricane Ian upon landfall from HMON.
The HMON forecast model has a large Hurricane Ian making landfall. A large hurricane is likely to produce higher storm surge. Large storm surge would be a severe problem for Florida. Many areas in Florida would experience winds ranging from 60 to 90 mph with gusts of 90 mph to 144 mph. Keep in mind, there are just forecast models for Hurricane Ian.
Florida better be prepared for the worst from Hurricane Ian. It is going to be a long few days for Florida.
Here is what I think will happen. -Ian is likely to undergo rapid intensification to a Category 4 hurricane. -Ian will make landfall somewhere along the West Coast of Florida on Wednesday evening or night. -Storm surge will likely very damaging for Florida.
Hurricane Ian is currently a Category 2 hurricane as of 11:00 PM from the National Hurricane Center (NHC). Ian has 105 mph winds and central pressure of 962 millibars. It is getting closer to Western Cuba. It is going to be a long and rough night for Western Cuba. Once Ian passes Western Cuba, it will enter the warm Gulf Of Mexico. Where does Ian go? Here is the forecast model from National Center for Atmospheric Research (NCAR). It is a heat map generated by QGIS. The heat map use points within 300 mile/480 kilometers radius. I used the latest forecast, which is at 0000Z.
Most of the forecast model have Ian heading towards Florida. One has it going westward towards Louisiana, which is unlikely. Tampa Bay Area looks like it is in the bull’s eye of where Hurricane Ian could make landfall. The other question is how strong will Ian be? It is also from NCAR.
Most intensity forecast have Ian as a major hurricane by tomorrow. Most keep it as Category 3 with one having Ian as a Category 4. I consider intensity forecast models to be unreliable. I think Ian is undergoing rapid intensification. I would not be surprised if Ian becomes a Category 5 hurricane. The waters around Cuba and Eastern Gulf Of Mexico can support a Category 5 hurricane. Here is a Maximum Potential Hurricane Intensity for the Gulf of Mexico. It is courtesy of Center for Ocean-Land-Atmosphere (COLA).
If conditions are right, Ian has the potential to have a central pressure of 880 millibars or lower with winds of over 190 mph. That is if the conditions are near perfect. I do not think Ian will have a central pressure of 880 millibars or lower and have 190 mph winds. North of Ian, there is strong wind shear. Here is a wind shear map from CIMSS.
Wind shear is what tends to prevent hurricanes from reaching their maximum potential. Ian at most is likely to have 160 to 165 mph winds and central pressure of 910 to 930 millibars. There is a stationary cold front, which is producing wind shear. That is likely to make Ian move slower. The slower Ian moves, the higher chance for heavy rain and storm surge. Slower moving hurricanes produce higher storm surge. If Ian was to slow down, the storm surge is going to be a severe problem for the Tampa Bay Area.
The Tampa Bay Area have not had a major hurricane make landfall since 1921. It is the 1921 Tampa Bay or Tarpon Springs Hurricane of 1921. It was a Category 4 hurricane that made landfall on October 25, 1921 with 120 mph winds. It produced storm surge of 11 feet in Downtown Tampa. It was likely a large hurricane when it made landfall. The hurricane claimed 8 lives. If it happened today, it would be catastrophic for the Tampa Bay Area.
Tampa Bay is one of the most vulnerable to storm surge. The bay is a large area of shallow water. It also a funnel shape. Those combinations are very conducive to high storm surge. One reason why the areas off of Louisiana and Mississippi, Southeast Texas, Big Bend Coast of Florida, New York City, and Bangladesh have high storm surge.
Corelogic did an analysis of most vulnerable for hurricane in terms of property damage. Tampa has a high risk for storm surge and hurricane winds, which makes them vulnerable. New York City is the most vulnerable to storm surge and hurricane winds.
Here is what I think will happen. -Ian is likely to undergo rapid intensification. -Ian will make landfall on Western Cuba as an intensifying Category 3 hurricane. -Ian could be Category 5 hurricane once it is over the Gulf Of Mexico.
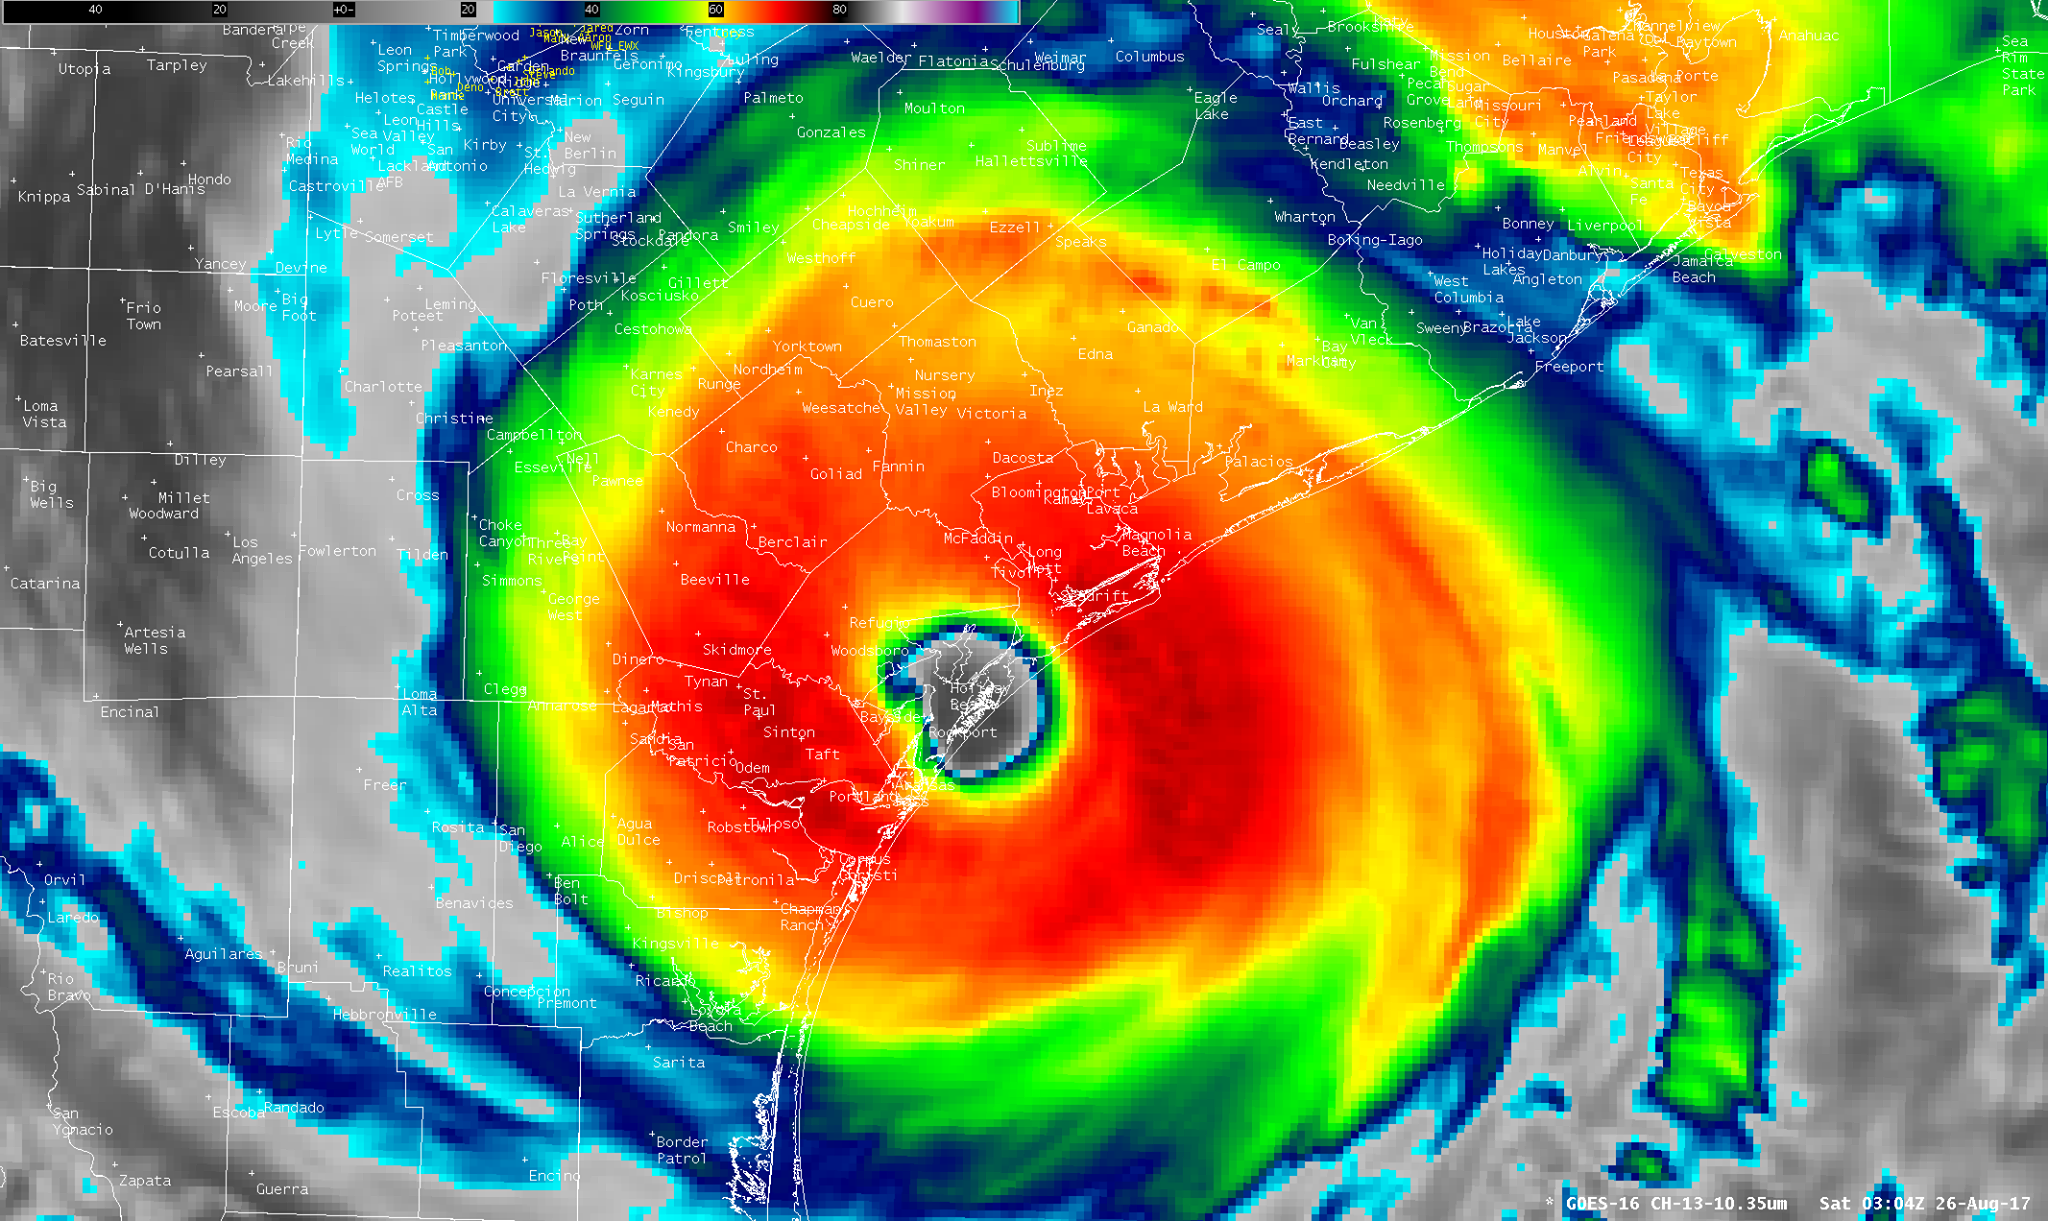
It is hard to believe, it has been five years since Hurricane Harvey made landfall near Port Aransas as a Category 4 hurricane with 130 mph winds. So much has happened since Harvey from COVID-19 Pandemic to Ukraine War. Harvey is the first major hurricane to make landfall on America since Wilma on October 24, 2005. Harvey made landfall on August 25, 2017. That is 43,23 days apart or 11 years, 10 months, 1 day or 142 months apart!
South Texas is hammered by strong wind, storm surge, and heavy rain. It packs a devastating punch. It is mainly along the coast in the Port Aransas area.
Once Harvey made landfall, it starts to weaken. Harvey is lingering over Texas. Large thunderstorms form near the center on the afternoon and evening of August 26, 2022. The large area of thunderstorms move toward Houston.
Doppler radar of Hurricane Harvey from National Weather Service.
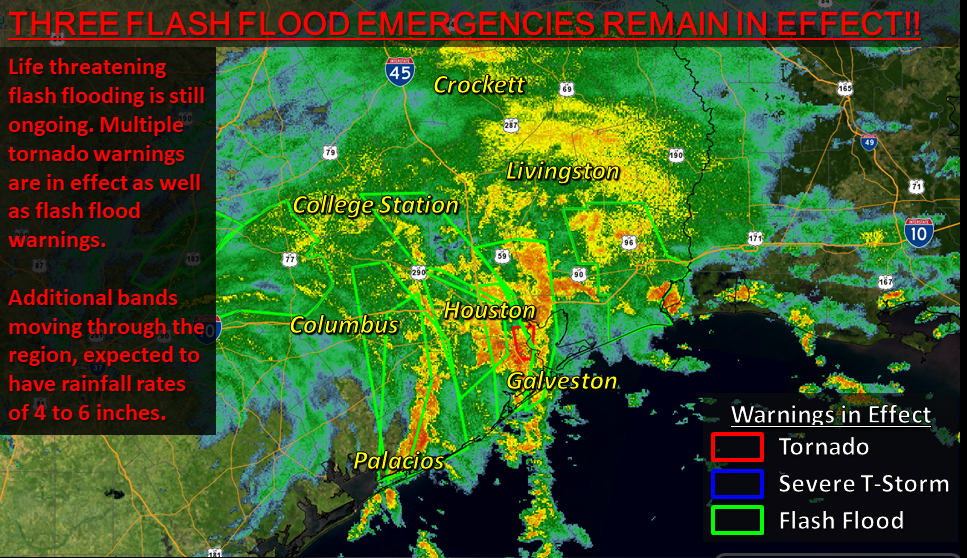
The thunderstorms go over Houston area dumping heavy rain on the night of August 26, 2017 to the small hours of August 27, 2017. Heavy rain falls over and over on the Houston area.
Houston area is flooded. Large areas receive 15 to 35 inches of rain from Harvey! Many houses and buildings are flooded as bayous and rivers are overflowing from heavy rain. Streets and freeways are flooded.
Heavy rain continues to ravage Southeast Texas as Harvey lingers over Texas. Then Harvey exits Texas and goes over the Gulf of Mexico. Heavy rain falls over East Texas. Beaumont gets over 31 inches of rain including over 26 inches in a single calendar day on August 29, 2017!
Many areas saw over 30 inches of rain from Harvey. The highest recorded is 60.58 inches of rain in Nederland. Some areas likely got over 60 inches of rain. A Personal Weather Station (PWS) in Baytown recorded over 66 inches of rain during Harvey from August 25-31, 2017. The August 2017 total for that station is over 74 inches! I would not be surprised if some areas got up to 80 inches of rain from Harvey.
Once Harvey passed, it did $125 billion in damage, which is comparable to Hurricane Katrina in 2005. 103 people lost their life from Harvey in Texas. It is the deadliest Texas hurricane since 1919. The 1919 Florida Keys hurricane claimed at least 284 lives in Texas. It is likely up to 1,000 people died. It is probable more people died during Harvey, but were not counted.
The headlines have been dominated by heat waves, wildfires, and floods. America is engulfed in a heat wave regardless of region. The heavy rain and floods claimed at least 37 lives in Eastern Kentucky. Eastern Kentucky has a heat wave on top of it. Northern California has been ravaged by wildfires. July 2022 has been the hottest on record for Houston. It eclipses July 1980, in which America was in midst of a heat wave. How does July 2022 compare for Houston and America? Let’s start with Houston.
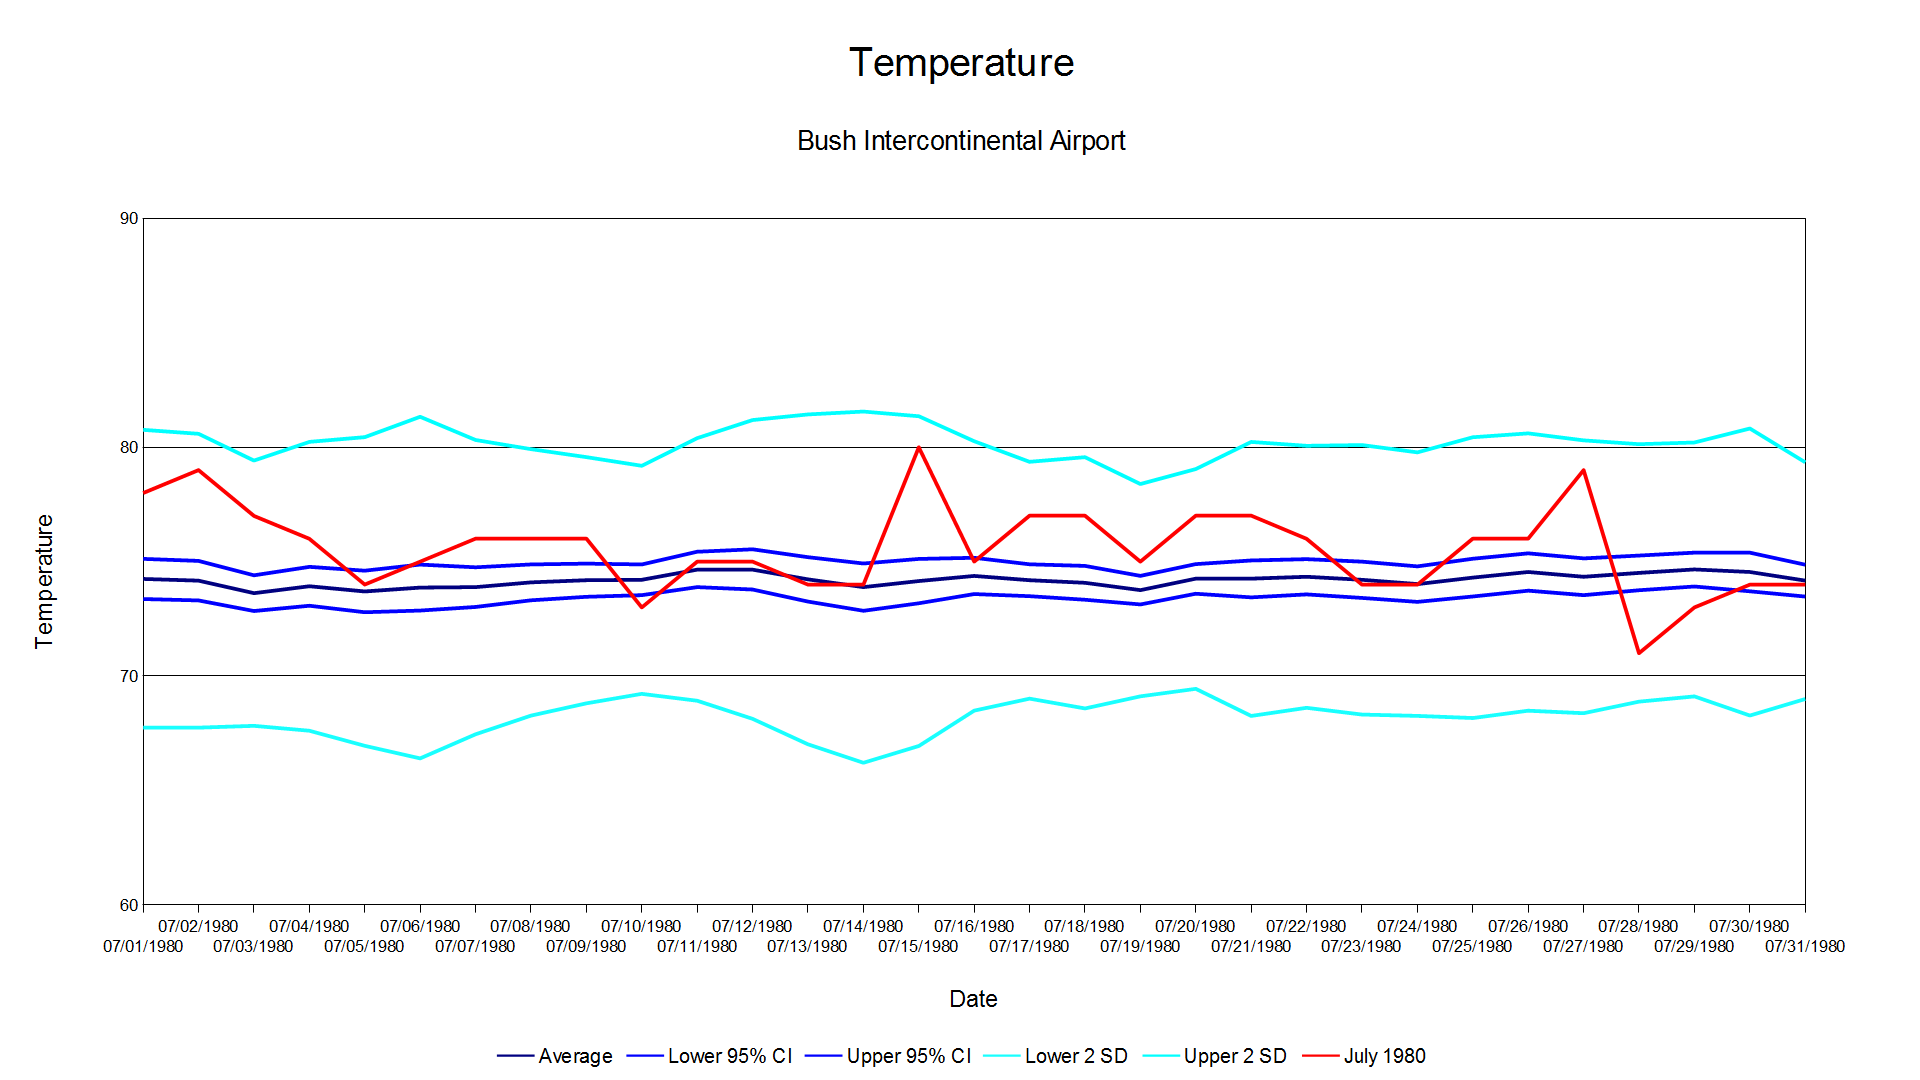
Here are charts of high, low, and average temperature for Houston, which is at Bush Intercontinental Airport. The data is from Global Historical Climatology Network – Daily (GHCN-Daily), Version 3. I calculated using JASP and generated graphs with Apache OpenOffice. The average and standard deviation are from 1969 to 2021. The charts have 95% Confidence Interval (CI), 2 Standard Deviations (2 SD) below and above, and actual temperature. Anything that is above or below 2 SD is considered unusual as it is 95% or greater to exceed the average or mean. Here is the high temperature for July 2022.
The hottest day was 105°F on July 10, 2022. It is the hottest July 10th recorded in Houston. It ties as the hottest July day on record in Houston with July 26, 1954. Houston recorded its hottest July 11th and 13th on record. There are days where July 2022 highs exceeded 2 SD. For the most part, the highs were within 2 SD. Certainly hot, but not extremely hot. Here is the low temperature for July 2022.
The low temperatures in July 2022 were likely to exceed 2 SD compared to high temperatures. There were often above average. There are no days where low temperature is below average. There are multiples days where lows exceeded 2 SD. The highest low temperatures recorded in Houston were on July 10-12 and July 18-20. They broke records for warmest low temperature recorded. The warm low temperatures contributed to July 2022 being warmest on record in Houston. Here is the average temperature for July 2022.
The average temperature exceeded 2 SD due to warm nights and days on July 10-12 and July 18-20. Let’s look at July 1980, the previous hottest July on record in Houston. Here is the high temperature for July 1980.
July 1980 highs were more likely to exceed 2 SD compared to July 2022. Many record July highs in Houston were set in July 1980. Texas and America were engulfed in a heat wave. The 1980 heat wave claimed at least 10,000 lives. The 1980 heat wave claimed more lives than 9/11, Hurricane Katrina or Hurricane Maria. July 1980 had more 100°F days than July 2022. July 1980 had 18 100°F days, while July 2022 had 13 100°F days. July 1980 is certainly hotter than July 2022 on that ground. Here is the low temperature for July 1980.
The low temperatures of July 1980 were within 2 SD. They were more likely to be within the average than July 2022. There were no record warm low temperatures set in July 1980, unlike in July 2022. There are some days in July 1980 that are below average. The low temperature is the reason why July 2022 is the warmest on record. If July 1980 had warm low temperatures of July 2022, it would easily exceed July 2022 as the warmest on record. Here is the average temperature for July 1980.
The average temperature exceeded 2 SD in July 1980. However, they are not on the level of July 2022 in terms of average temperature. July 1980 had normal low temperatures, while July 2022 had warm low temperatures, which kept things warm. Here is a 2 meter temperature anomaly of the Northern Hemisphere for July 2022. It includes America. It is from Daily Mean Composites.
It was certainly hot in America. It was also hot in Europe and East Asia. The cold weather are mostly in Russian Far East, Siberia, Central Asia, Alaska, and Northwest Canada. It was certainly hot in July 2022. Now, if you think July 2022 was really hot, try July 1936. Here is a 2 meter temperature anomaly of the Northern Hemisphere for July 1936. It is from 20th Century Reanalysis Daily Composites.
July 1936 was very hot in America. It was in midst of the Dust Bowl as there was the Great Depression. The Dust Bowl likely exacerbated the Great Depression as farmers suffered greatly. Many records were set in July 1936 and August 1936. The Summer of 1936 is the hottest on record for America. They are yet to be broken to this very day.
Texas’s hottest recorded day occurred on August 12, 1936 in Seymour. Seymour reached a high of 120°F. It also reached 120°F in Monahans on June 28, 1994. They are Texas’s highest recorded temperature and yet to be broken to this very day. Oklahoma’s hottest days (not a mistype as it happened more than once) recorded occurred four times in 1936 in Alva (July 18, 1936), Altus (July 19, 1936 and August 12, 1936), and Poteau (August 10, 1936) as they reached 120°F. They are yet to be broken in Oklahoma to this very day. North Dakota’s hottest recorded day occurred on July 6, 1936 in Steele with a high of 121°F. It is North Dakota’s hottest day recorded. It is yet to be broken to this very day for North Dakota. New York City’s hottest recorded day occurred on July 9, 1936 with a high of 106°F. It remains the hottest day recorded in New York City to this very day. The 1936 Annual Heat Wave Index in America is the highest. It easily exceeds 2022.
The death toll from the July 1936 heat wave is at least 5,000 people. There was a jump in mortality in 1936 compared to 1935. It suggests the heat wave claimed more than 5,000 lives directly and indirectly. America had over 128 million people in 1936. If the July 1936 heat wave happened today with the current population, the death toll would exceed at least 12,000 lives and likely higher.
July 2022 was certainly hot, but it does not come nowhere to July 1936. It was really hot back in 1936. People managed to survive as people did not have air conditioning. Few people had air conditioning in their homes. Some people slept outside at night as it was cooler outside than inside. I would not be surprised if there were heat waves comparable to and exceeding 1936 that occurred in the past.
2022 is proven to be just a turbulent year, like 2020 and 2021. Ukraine is engulfed in a war with Russia. COVID-19 remains a problem as it is showing signs of subsiding. The 2020s has been a turbulent decade so far. Hurricane Season is coming as it starts on June 1, 2022. Here are other forecasts. ACE is short for Accumulated Cyclone Energy.
The analog years I am using are in which we are in a second year or greater La Nina year. Obviously, the forecast is uncertain with another La Nina, El Nino, or Neutral.
Based on this, the analog years are 1875, 1876, 1880, 1895, 1899, 1937, 1950, 1956, 1957, 1962, 1963, 1985, 1997, 2000, 2001, 2009, 2012. I look at Atlantic Multidecadal Oscillation (AMO), Pacific Decadal Oscillation (PDO), Northeast Pacific Warm Pool (NEPWP), Equatorial Indian Ocean (EIO), Tropical South Atlantic (TSAI), New Zealand Warm Pool (NZWP), Quasi-Biennial Oscillation (QBO), and Atlantic Main Development Region (MDR). Here is the ocean temperature anomaly map. It is from Tropical Tidbits.
All of the seasons had major hurricane, except 1895 and 1962. The most active is 2012 with 19 named storms, 10 hurricanes, and 2 major hurricanes. However, in terms of Accumulated Cyclone Energy (ACE), that goes to 1950. The least active is 1895 which only had 2 hurricanes and no major hurricanes. However, 1895 is before satellite. After 1966, the least active is 1997 with 3 hurricane and 1 major hurricane. Any season before satellite should be considered suspect. Even in satellite, some data is rather questionable.
Here are notable storms in the analog seasons.
1875 Indianola Hurricane (Hurricane #3)
1876 1876 San Felipe Hurricane (Hurricane #2) Cuba-South Florida Hurricane of 1876 (Hurricane #5)
1880 Hurricane #2 Hurricane #4
1895 Hurricane #2 Hurricane #5
1899 Tropical Storm #1 1899 Carrabelle Hurricane (Hurricane #2) Hurricane San Ciriaco of 1899 (Hurricane #3) Hurricane #4 Hurricane #5
1937 Tropical Storm #3
1950 Able Baker Dog Easy King
1956 Betsy Flossy Greta
1957 Audrey
1962 Daisy Ella
1963 Cindy Edith Flora Ginny Helena
1985 Elena Gloria Juan Kate
1997 Danny Erika
2000 Gordon Keith
2001 Allison Iris Michelle
2009 Ida
2012 Isaac Sandy
The analog season has some deadly and memorable storms. One of the deadliest hurricanes is Flora, which claimed over 8,000 lives in Cuba. Flora dumped over 150 inches of rain on Cuba, which led to massive flooding. San Ciriaco Hurricane is a long lived major hurricane that ravaged Puerto Rico. It claimed more than 3,800 lives. Flora and San Ciriaco Hurricane remain some of the deadliest Atlantic as of today. Before Indianola was destroyed in 1886 by the 1886 Indianola Hurricane, Indianola was ravaged by Indianola Hurricane in 1875. Some produced heavy rain and flooding from Tropical Storm #1 (1899), Easy, Cindy, and Allison. The 1899 Tropical Storm #1 dumped heavy rain over a large area in Texas. Hearne got 35 inches of rain. The flooding claimed 284 lives. It was the largest rainfall event prior to Harvey. Hurricane Danny dumped nearly 38 inches of rain in Dauphin Island as it lingered over Alabama. Allison dumped 40 inches of rain in a 5 day span including 28 inches in 12 hours in Northeast Houston. The analog seasons were not kind to Texas. It also has Audrey, which ravaged East Texas and Southwest Louisiana in June 1957. It was also not kind with the Eastern US. Gloria and Sandy ravaged the Northeast, including New York City. Sandy produced monster storm surge for New York and New Jersey. I am not suggesting 2022 will see something like 1875 Indianola, Tropical Storm #1 (1899), San Ciriaco Hurricane, Flora, Elena, Juan, Kate, Danny, Allison, and Sandy.
The Gulf of Mexico and off the Southeastern US looks to have the most development. Sames goes with around the Windward Islands and Western Caribbean. I never make landfall predictions. I strongly object to making landfall forecasts this early. I think it is irresponsible to make landfall predictions this early on. Everyone is at equal risk.
Here is a statistical analysis of analog seasons vs all season. It was done with PSPP.
Analog
Tropical Storm
Mean
10.53
95% Confidence Interval for Mean
Lower Bound
8.52
Upper Bound
12.54
5% Trimmed Mean
10.37
Median
10
Variance
15.26
Std. Deviation
3.91
Minimum
5
Maximum
19
Range
14
Interquartile Range
6
Skewness
0.62
Kurtosis
-0.19
Hurricane
Mean
5.76
95% Confidence Interval for Mean
Lower Bound
4.33
Upper Bound
7.2
5% Trimmed Mean
5.68
Median
5
Variance
7.82
Std. Deviation
2.8
Minimum
2
Maximum
11
Range
9
Interquartile Range
5
Skewness
0.53
Kurtosis
-1.07
Major Hurricane
Mean
2.06
95% Confidence Interval for Mean
Lower Bound
1.3
Upper Bound
2.82
5% Trimmed Mean
1.95
Median
2
Variance
2.18
Std. Deviation
1.48
Minimum
0
Maximum
6
Range
6
Interquartile Range
2
Skewness
1.07
Kurtosis
2.05
ACE
Mean
94.06
95% Confidence Interval for Mean
Lower Bound
70.91
Upper Bound
117.21
5% Trimmed Mean
90.5
Median
78.7
Variance
2026.7
Std. Deviation
45.02
Minimum
40.9
Maximum
211.3
Range
170.4
Interquartile Range
68.2
Skewness
1.14
Kurtosis
1.3
How do analog seasons compare as a whole. Statistics from 1870 to 2021.
Tropical Storm
Mean
10.32
95% Confidence Interval for Mean
Lower Bound
9.58
Upper Bound
11.06
5% Trimmed Mean
10.05
Median
10
Variance
21.35
Std. Deviation
4.62
Minimum
1
Maximum
30
Range
29
Interquartile Range
6
Skewness
1.09
Kurtosis
2.31
Hurricane
Mean
5.64
95% Confidence Interval for Mean
Lower Bound
5.21
Upper Bound
6.07
5% Trimmed Mean
5.53
Median
5
Variance
7.11
Std. Deviation
2.67
Minimum
0
Maximum
15
Range
15
Interquartile Range
3
Skewness
0.71
Kurtosis
0.56
Major Hurricane
Mean
2.07
95% Confidence Interval for Mean
Lower Bound
1.81
Upper Bound
2.34
5% Trimmed Mean
1.96
Median
2
Variance
2.74
Std. Deviation
1.66
Minimum
0
Maximum
7
Range
7
Interquartile Range
2
Skewness
0.87
Kurtosis
0.22
ACE
Mean
94.48
95% Confidence Interval for Mean
Lower Bound
85.83
Upper Bound
103.14
5% Trimmed Mean
91.08
Median
83.85
Variance
2918.69
Std. Deviation
54.02
Minimum
2.5
Maximum
258.6
Range
256.1
Interquartile Range
73.77
Skewness
0.89
Kurtosis
0.38
The 95% Confidence Interval for analog season vs the whole season is wide. Analog seasons could either be inactive or active. Analog seasons are above average compared to the whole season.
What is my prediction for this season? 12 to 22 named storms, likely 17 named storms 6 to 14 hurricanes, likely 10 hurricanes 2 to 6 major hurricanes with 4 major hurricanes ACE is 120 to 200 with ACE likely of 130 to 190
Let’s see how my May 2021 hurricane forecast compare to the actual 2021 season.
14 to 22 named storms, likely 17 named storms 6 to 12 hurricanes, likely 9 hurricanes 2 to 6 major hurricanes with 4 major hurricanes ACE is 120 to 190 with ACE likely of 130 to 180
2021 Actual Number 21 Named Storms 7 Hurricanes 4 Major Hurricanes 146 ACE
Many including myself got the forecast off. The 2021 Hurricane Season was more active than forecasted. The ACE was under compared to the actual ACE. I did get the ACE right. There is always room for improvement.
Regardless of forecast, I think 2022 could be an interesting hurricane season. It could be a harry one. It only takes one to be a devastating season regardless of how inactive or active a season is.


