Hot July 2022

The headlines have been dominated by heat waves, wildfires, and floods. America is engulfed in a heat wave regardless of region. The heavy rain and floods claimed at least 37 lives in Eastern Kentucky. Eastern Kentucky has a heat wave on top of it. Northern California has been ravaged by wildfires. July 2022 has been the hottest on record for Houston. It eclipses July 1980, in which America was in midst of a heat wave. How does July 2022 compare for Houston and America? Let’s start with Houston.

Here are charts of high, low, and average temperature for Houston, which is at Bush Intercontinental Airport. The data is from Global Historical Climatology Network – Daily (GHCN-Daily), Version 3. I calculated using JASP and generated graphs with Apache OpenOffice. The average and standard deviation are from 1969 to 2021. The charts have 95% Confidence Interval (CI), 2 Standard Deviations (2 SD) below and above, and actual temperature. Anything that is above or below 2 SD is considered unusual as it is 95% or greater to exceed the average or mean. Here is the high temperature for July 2022.

The hottest day was 105°F on July 10, 2022. It is the hottest July 10th recorded in Houston. It ties as the hottest July day on record in Houston with July 26, 1954. Houston recorded its hottest July 11th and 13th on record. There are days where July 2022 highs exceeded 2 SD. For the most part, the highs were within 2 SD. Certainly hot, but not extremely hot. Here is the low temperature for July 2022.

The low temperatures in July 2022 were likely to exceed 2 SD compared to high temperatures. There were often above average. There are no days where low temperature is below average. There are multiples days where lows exceeded 2 SD. The highest low temperatures recorded in Houston were on July 10-12 and July 18-20. They broke records for warmest low temperature recorded. The warm low temperatures contributed to July 2022 being warmest on record in Houston. Here is the average temperature for July 2022.

The average temperature exceeded 2 SD due to warm nights and days on July 10-12 and July 18-20. Let’s look at July 1980, the previous hottest July on record in Houston. Here is the high temperature for July 1980.

July 1980 highs were more likely to exceed 2 SD compared to July 2022. Many record July highs in Houston were set in July 1980. Texas and America were engulfed in a heat wave. The 1980 heat wave claimed at least 10,000 lives. The 1980 heat wave claimed more lives than 9/11, Hurricane Katrina or Hurricane Maria. July 1980 had more 100°F days than July 2022. July 1980 had 18 100°F days, while July 2022 had 13 100°F days. July 1980 is certainly hotter than July 2022 on that ground. Here is the low temperature for July 1980.

The low temperatures of July 1980 were within 2 SD. They were more likely to be within the average than July 2022. There were no record warm low temperatures set in July 1980, unlike in July 2022. There are some days in July 1980 that are below average. The low temperature is the reason why July 2022 is the warmest on record. If July 1980 had warm low temperatures of July 2022, it would easily exceed July 2022 as the warmest on record. Here is the average temperature for July 1980.

The average temperature exceeded 2 SD in July 1980. However, they are not on the level of July 2022 in terms of average temperature. July 1980 had normal low temperatures, while July 2022 had warm low temperatures, which kept things warm. Here is a 2 meter temperature anomaly of the Northern Hemisphere for July 2022. It includes America. It is from Daily Mean Composites.

It was certainly hot in America. It was also hot in Europe and East Asia. The cold weather are mostly in Russian Far East, Siberia, Central Asia, Alaska, and Northwest Canada. It was certainly hot in July 2022. Now, if you think July 2022 was really hot, try July 1936. Here is a 2 meter temperature anomaly of the Northern Hemisphere for July 1936. It is from 20th Century Reanalysis Daily Composites.

July 1936 was very hot in America. It was in midst of the Dust Bowl as there was the Great Depression. The Dust Bowl likely exacerbated the Great Depression as farmers suffered greatly. Many records were set in July 1936 and August 1936. The Summer of 1936 is the hottest on record for America. They are yet to be broken to this very day.

Texas’s hottest recorded day occurred on August 12, 1936 in Seymour. Seymour reached a high of 120°F. It also reached 120°F in Monahans on June 28, 1994. They are Texas’s highest recorded temperature and yet to be broken to this very day. Oklahoma’s hottest days (not a mistype as it happened more than once) recorded occurred four times in 1936 in Alva (July 18, 1936), Altus (July 19, 1936 and August 12, 1936), and Poteau (August 10, 1936) as they reached 120°F. They are yet to be broken in Oklahoma to this very day. North Dakota’s hottest recorded day occurred on July 6, 1936 in Steele with a high of 121°F. It is North Dakota’s hottest day recorded. It is yet to be broken to this very day for North Dakota. New York City’s hottest recorded day occurred on July 9, 1936 with a high of 106°F. It remains the hottest day recorded in New York City to this very day. The 1936 Annual Heat Wave Index in America is the highest. It easily exceeds 2022.

The death toll from the July 1936 heat wave is at least 5,000 people. There was a jump in mortality in 1936 compared to 1935. It suggests the heat wave claimed more than 5,000 lives directly and indirectly. America had over 128 million people in 1936. If the July 1936 heat wave happened today with the current population, the death toll would exceed at least 12,000 lives and likely higher.

July 2022 was certainly hot, but it does not come nowhere to July 1936. It was really hot back in 1936. People managed to survive as people did not have air conditioning. Few people had air conditioning in their homes. Some people slept outside at night as it was cooler outside than inside. I would not be surprised if there were heat waves comparable to and exceeding 1936 that occurred in the past.

What will August 2022 be like? We shall see.

Hurricane Sally, Wildfires, And COVID-19

The Atlantic is heating up with Paulette, Rene, Sally, Teddy, and Vicky. Rene is no more, while Paulette and Sally are hurricanes. Sally is the biggest threat as it is in the Gulf of Mexico, which I will discuss later. There are monster wildfires burning in California, Oregon, and Washington. This is all on top of the COVID-19 pandemic. As of 9/14/2020, there are over 29 million confirmed cases of COVID-19 with more than 932,000 deaths. There are over 7 million who are currently infected with more than 60,000 who are severely ill. It is from Worldometer. If you want to read my analysis on COVID-19, check out my other blog, The Ebola Zone. 2020 has been nothing but a terrible year all around no matter how one spins it. The whole world is of never ending disasters ranging from public health to weather. So much ground the cover.

The whole West is on fire. The whole West is covered in thick and acrid smoke. It is from Regional and Mesoscale Meteorology Branch (RAMMB)

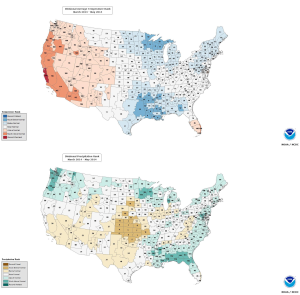
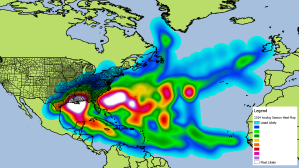
Here is a heat map of active wildfires in the past 7 days. It is from Visible Infrared Imaging Radiometer Suite (VIIRS), which has a resolution of 375 meters or 1,230 feet. It is from NASA Active Fire Data. The heatmap is within 100 mile/160 kilometers radius from the point show.

It is really dire in the Western US. The whole West is on fire. Dire is a severe understatement. The death toll is probably going to be high once it is all over. Here is a Dense Smoke Advisory from NWS Reno.

URGENT - WEATHER MESSAGE
National Weather Service Reno NV
218 PM PDT Mon Sep 14 2020

CAZ070>073-NVZ001>005-160000-
/O.NEW.KREV.SM.Y.0009.200914T2118Z-200916T0000Z/
Surprise Valley California-Lassen-Eastern Plumas-
Eastern Sierra Counties-Greater Lake Tahoe Area-Mono County-
Mineral and Southern Lyon Counties-Greater Reno-Carson City-
Minden Area-Western Nevada Basin and Range including Pyramid Lake-
Northern Washoe County-
Including the cities of Cedarville, Eagleville, Fort Bidwell,
Portola, Susanville, Westwood, Sierraville, Loyalton,
South Lake Tahoe, Tahoe City, Truckee, Markleeville, Bridgeport,
Coleville, Lee Vining, Mammoth Lakes, Hawthorne, Yerington,
Smith Valley, Mina, Schurz, Stateline, Glenbrook,
Incline Village, Sparks, Verdi, Gardnerville, Virginia City,
Fernley, Fallon, Lovelock, Silver Springs, Nixon, Imlay, Empire,
and Gerlach
218 PM PDT Mon Sep 14 2020

...DENSE SMOKE ADVISORY IN EFFECT UNTIL 5 PM PDT TUESDAY...

* WHAT...Light west-southwest winds will continue to push smoke
into the region from several wildfires burning across
California. The near-surface smoke concentration may improve
during the afternoon today and tomorrow but looks to degrade
during the evening and overnight hours through Tuesday.

* WHERE...Western Nevada Basin and Range including Pyramid Lake,
Mineral and Southern Lyon Counties, Mono County, Surprise
Valley California, Lassen-Eastern Plumas-Eastern Sierra
Counties, Greater Lake Tahoe Area, Greater Reno-Carson City-
Minden Area and Northern Washoe County.

* WHEN...Until 5 PM PDT Tuesday.

* IMPACTS...Poor air quality and reduced visibility below one mile
in areas. Check airnow.gov for updated air quality information.

* ADDITIONAL DETAILS...The areas which will see the highest risk
of dense smoke will be the Eastern Sierra, Carson Valley, Smith
Valley, Hawthorne, and northeastern California.

PRECAUTIONARY/PREPAREDNESS ACTIONS...

Stay indoors as much as possible when smoke is present. Avoid
strenuous activity, especially if you are sensitive to poor air
quality, such as the elderly, children and anyone with chronic
illness or respiratory problems. Consider postponing outdoor
activities. Check airnow.gov for the latest air quality
information.

&&

$$

For more information from the National Weather Service visit
http://weather.gov/rev

People are advised to stay indoor. That is nearly impossible for people who have to evacuate in the fire zone. I do not know when the fires will end. The sooner the better. Anyways, let’s go to Hurricane Sally.

Hurricane Sally is a Category 2 hurricane with 100 mph winds. This as of 10:00 PM CDT from the National Hurricane Center (NHC). It is close to the coast and moving slowly.

000
WTNT34 KNHC 150311 CCA
TCPAT4

BULLETIN
Hurricane Sally Advisory Number 15...Corrected
NWS National Hurricane Center Miami FL AL192020
1000 PM CDT Mon Sep 14 2020

Corrected Storm Surge Hazards section

...OUTER RAIN BANDS MOVING ONSHORE IN THE FLORIDA PANHANDLE...
...LIFE-THREATENING STORM SURGE, HURRICANE-FORCE WINDS, AND FLASH
FLOODING LIKELY ALONG PORTIONS OF THE NORTHERN GULF COAST STARTING
LATER TONIGHT AND TUESDAY...

SUMMARY OF 1000 PM CDT...0300 UTC...INFORMATION
-----------------------------------------------
LOCATION...28.9N 87.6W
ABOUT 90 MI...145 KM E OF THE MOUTH OF THE MISSISSIPPI RIVER
ABOUT 130 MI...210 KM SE OF BILOXI MISSISSIPPI
MAXIMUM SUSTAINED WINDS...100 MPH...155 KM/H
PRESENT MOVEMENT...WNW OR 300 DEGREES AT 3 MPH...6 KM/H
MINIMUM CENTRAL PRESSURE...986 MB...29.12 INCHES

WATCHES AND WARNINGS
--------------------
CHANGES WITH THIS ADVISORY:

The Hurricane Warning west of Grand Isle to Morgan City, Louisiana,
has been downgraded to a Tropical Storm Warning.

SUMMARY OF WATCHES AND WARNINGS IN EFFECT:

A Storm Surge Warning is in effect for...
* Port Fourchon Louisiana to the Okaloosa/Walton County Line Florida
* Lake Pontchartrain, Lake Maurepas, and Lake Borgne
* Mobile Bay

A Hurricane Warning is in effect for...
* Grand Isle Louisiana to the Navarre Florida
* Lake Pontchartrain and Lake Maurepas including metropolitan New
Orleans

A Tropical Storm Warning is in effect for...
* East of of Navarre Florida to Indian Pass Florida
* West of Grand Isle to Morgan City Louisiana

A Storm Surge Warning means there is a danger of life-threatening
inundation, from rising water moving inland from the coastline,
during the next 36 hours in the indicated locations. For a depiction
of areas at risk, please see the National Weather Service Storm
Surge Watch/Warning Graphic, available at hurricanes.gov. This is a
life-threatening situation. Persons located within these areas
should take all necessary actions to protect life and property from
rising water and the potential for other dangerous conditions.
Promptly follow evacuation and other instructions from local
officials.

A Hurricane Warning means that hurricane conditions are expected
somewhere within the warning area. Preparations to protect life
and property should be rushed to completion.

A Tropical Storm Warning means that tropical storm conditions are
expected somewhere within the warning area within 36 hours.

For storm information specific to your area, including possible
inland watches and warnings, please monitor products issued by your
local National Weather Service forecast office.

DISCUSSION AND OUTLOOK
----------------------
At 1000 PM CDT (0300 UTC), the center of Hurricane Sally was located
near latitude 28.9 North, longitude 87.6 West. Sally is moving
toward the west-northwest near 3 mph (6 km/h) and this motion is
expected to continue through Tuesday morning. A northward turn is
likely by Tuesday afternoon, and a slow north-northeastward to
northeastward motion is expected Tuesday night through Wednesday
night. On the forecast track, the center of Sally will move near
the coast of southeastern Louisiana tonight and Tuesday, and make
landfall in the hurricane warning area Tuesday night or Wednesday.

Maximum sustained winds are near 100 mph (155 km/h) with higher
gusts. Some strengthening is forecast early Tuesday and Sally is
expected to be a dangerous hurricane when it moves onshore along the
north-central Gulf coast.

Hurricane-force winds extend outward up to 45 miles (75 km) from the
center and tropical-storm-force winds extend outward up to 125 miles
(205 km). A buoy south of Dauphin Island, Alabama, recently
reported sustained winds of 61 mph (98 km/h) and a wind gust of 69
mph (111 km/h).

The estimated minimum central pressure based on data from the
NOAA and Air Force Hurricane Hunters is 986 mb (29.12 inches).

HAZARDS AFFECTING LAND
----------------------
Key messages for Sally can be found in the Tropical Cyclone
Discussion under AWIPS header MIATCDAT4 and WMO header WTNT44 KNHC,
and on the web at www.hurricanes.gov/text/MIATCDAT4.shtml

STORM SURGE: The combination of a dangerous storm surge and the
tide will cause normally dry areas near the coast to be flooded by
rising waters moving inland from the shoreline. The water could
reach the following heights above ground somewhere in the indicated
areas if the peak surge occurs at the time of high tide...

Mouth of the Mississippi River to Dauphin Island including Lake
Borgne...6-9 ft
Mobile Bay...6-9 ft
Lake Pontchartrain and Lake Maurepas...3-5 ft
Dauphin Island to AL/FL Border...4-7 ft
Port Fourchon to Mouth of the Mississippi River...2-4 ft
AL/FL Border to Okaloosa/Walton County Line including Pensacola Bay
an Choctawhatchee Bay...2-4 ft
Okaloosa/Walton County Line to Chassahowitzka including Saint Andrew
Bay...1-3 ft
Burns Point to Port Fourchon...1-2 ft

Overtopping of local levees outside of the Hurricane and Storm
Damage Risk Reduction System is possible where local inundation
values may be higher than those shown above.

The deepest water will occur along the immediate coast in areas of
onshore winds, where the surge will be accompanied by large and
damaging waves. Surge-related flooding depends on the relative
timing of the surge and the tidal cycle, and can vary greatly over
short distances. For information specific to your area, please see
products issued by your local National Weather Service forecast
office.

WIND: Hurricane conditions are expected to begin within the
hurricane warning area later tonight and Tuesday. Tropical storm
conditions expected to begin within the warning area during the
next few hours.

RAINFALL: Sally is expected to be a slow moving system as it
approaches land, producing 8 to 16 inches of rainfall with isolated
amounts of 24 inches over portions of the central Gulf Coast from
the western Florida Panhandle to far southeastern Mississippi
through the middle of the week. Life-threatening flash flooding is
likely. In addition, this rainfall will likely lead to widespread
minor to isolated major flooding on area rivers.

Sally is forecast to turn inland early Wednesday and track across
the Southeast producing rainfall of 4 to 8 inches, with isolated
maximum amounts of 12 inches, across portions of eastern
Mississippi, central Alabama, northern Georgia, southeastern
Tennessee, and the western Carolinas. Significant flash and urban
flooding is likely, as well as widespread minor to moderate flooding
on some rivers.

Outer bands of Sally could produce additional rainfall of 1 to 3
inches across the Florida peninsula through tonight. This rainfall
may produce flash and urban flooding and prolong high flows and
ongoing minor flooding on rivers across central Florida.

TORNADOES: A tornado or two will be possible late tonight through
early Tuesday in coastal areas of the Florida Panhandle and Alabama.
The threat for tornadoes should increase and slowly spread inland
during the day on Tuesday.

SURF: Swells from Sally will continue to affect the coast from the
Florida Big Bend westward to southeastern Louisiana during the next
couple of days. These swells are likely to cause life-threatening
surf and rip current conditions. Please consult products from your
local weather office.

NEXT ADVISORY
-------------
Next intermediate advisory at 100 AM CDT.
Next complete advisory at 400 AM CDT.

$$
Forecaster Cangialosi/Stewart

How strong will Sally get? Here is an intensity forecast. The data and intensity forecast are from NCAR-Tropical Cyclone Guidance.

Most forecast model keep Sally at Category 2. The exception is SHF5, which has it as a Category 3 hurricane. I think Sally will become a Category 3 hurricane and make landfall as one somewhere along the Central Gulf Coast. Many are wondering where Sally will go. Here is a heat map using points within 300 mile/480 kilometers radius. I used the latest forecast, which is 0000Z. All GIS maps are created from QGIS.

Most models have Sally making landfall on Mississippi or Alabama on Tuesday night to early Wednesday morning. The slow motion of the hurricane increases chance of higher storm surge and heavier rain. Flooding would be a serious problem for areas affected by Sally. As I am typing, tropical storm force winds are affecting Alabama, Florida, and Louisiana. It should reach Mississippi later tonight.

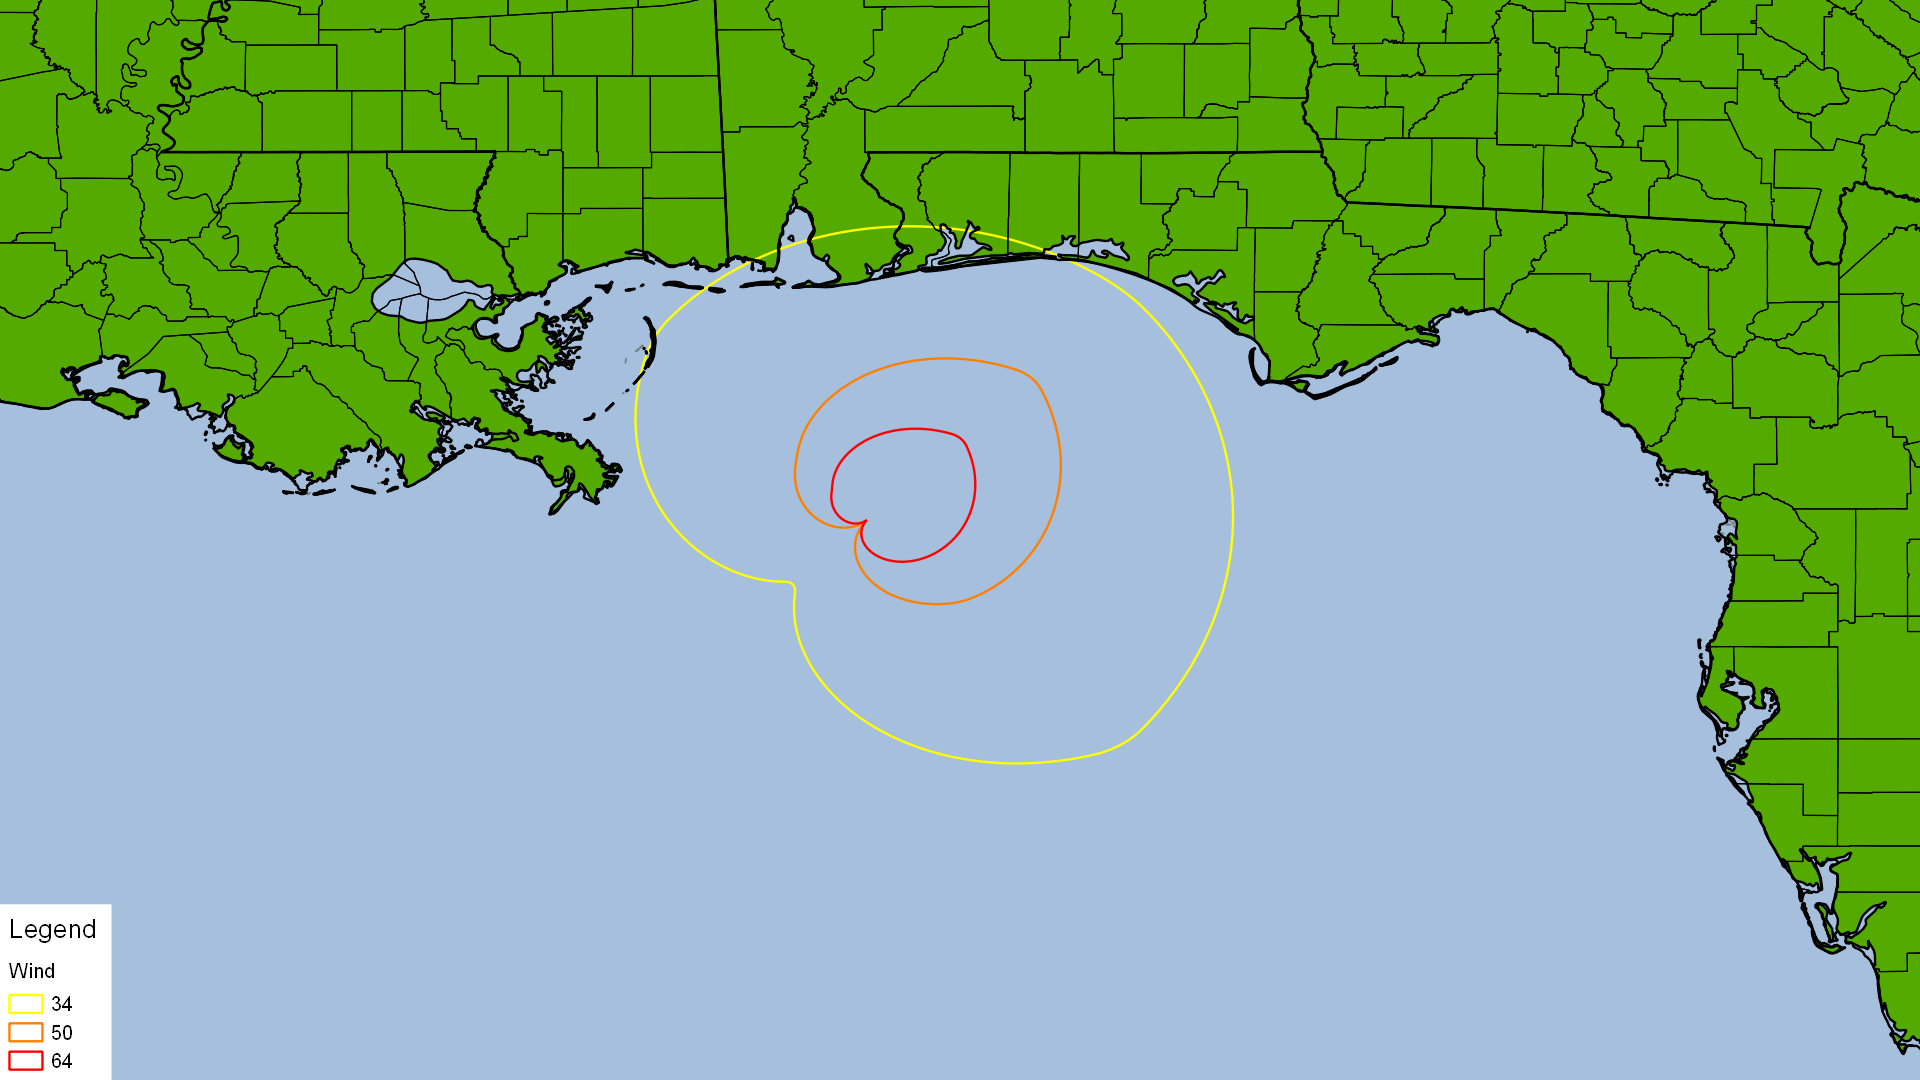
Hurricane force winds extend up to 45 miles from the center with tropical storm force winds extending up to 125 miles. Sally is not a large hurricane. Smaller hurricanes produce lower storm surge. However, the slow movement is likely to produce higher storm surge. It is also the width and and slope of the ocean bottom that is a factor as well. The area where Sally is has produced monster storm surge from Camille and Katrina. I am not expecting storm surge comparable to Camille or Katrina at this time.

So much weather events going on in America on top of COVID-19 pandemic that is ravaging the world. Hopefully, anyone who needed to evacuate did evacuate.

Spring 2016 Report

Flower01

It is deja vu! Spring 2016 was wet like Spring 2015 despite El Nino fading. To make matters worse, there was severe flooding in April and May, which dumped up to 24 inches of rain in both events! That is something you see with tropical cyclones or core rain events with warm core low pressure systems. They are often from tropical cyclones.

For Texas, it has been mostly wet. For others, where’s the rain?

2016_SpringPrecipitationDivisionalRanks

2016_SpringTemperatureDivisionalRanks

America 2016 Spring
Mean Temperature: 53.68°F
Total Rainfall: 9.03

America Spring Temperature (1895-2016)
Mean: 51.10°F
Median: 50.87°F
Standard Deviation: 1.39
Lowest: 56.18°F (2012)
Highest: 47.37°F (1917)

America Spring Rainfall (1895-2016)
Mean: 7.95
Median: 7.95
Standard Deviation: 0.98
Lowest: 5.58 (1925)
Highest: 10.40 (1991)

It was a warm spring, but not a record breaking spring for America. It is nowhere like 2012. The average temperature is 1 standard deviation from the mean in terms of temperature. That is unusual, but not extraordinarily warm. If it was 2 standard deviation or greater that would be abnormal. It was abnormally warm for spring time in America.

It was much wetter as a whole. In fact, the Spring 2016 rainfall total is exceeds by 1 standard deviation. It was a wet spring for most of America.

Texas 2016 Spring
Mean Temperature: 66.27°F
Total Rainfall: 11.90

Texas Spring Temperature (1895-2016)
Mean: 64.76°F
Median: 64.73°F
Standard Deviation: 1.76
Lowest: 69.67°F (2012)
Highest: 59.93°F (1931)

Texas Spring Rainfall (1895-2016)
Mean: 7.37
Median: 7.05
Standard Deviation: 2.34
Lowest: 2.53 (2011)
Highest: 16.48 (2015)

It was warmer than normal for spring in Texas. It is 1 standard deviation from the mean.

It is wet, but not like 2015, which was wetter. Actually, it is the eighth wettest spring on record as it ties with 1914. It was indeed a wet spring for Texas, like last spring. Having two wet springs back to back is a rarity. Here is the top 10 wettest spring in Texas since 1895.

Top 10 Wettest Spring In Texas
1.) 2015 16.48
2.) 1957 14.75
3.) 1905 12.59
4.) 1941 12.43
5.) 1900 12.36
6.) 2007 12.16
7,) 1922 11.97
8.) 1914/2016 11.90
9.) 1997 10.85
10.) 1929 10.79

Many of the wettest springs occurred when El Nino is developing (1914, 1957, 1997, and 2015), persistent (1905 and 1941) or dying (1900 and 2007). 1922 was La Nina, while 1929 was Neutral. It shows that El Nino does have an impact on spring rainfall,whether is strengthening or dying. Interesting to note hurricanes made hurricanes made landfall in 1900, 1929, 1941, 1957, and 2007. Two were major hurricanes, Galveston Hurricane and Audrey in 1957.

Upper Texas Coast 2016 Spring
Mean Temperature: 71.07°F
Total Rainfall: 20.77

Upper Texas Coast Spring Temperature (1895-2016)
Mean: 68.54°F
Median: 68.42°F
Standard Deviation: 1.69
Lowest: 72.83°F (2012)
Highest: 63.37°F (1931)

Upper Texas Coast Spring Rainfall (1895-2016)
Mean: 10.58
Median: 10.02
Standard Deviation: 4.53
Lowest: 2.43 (2011)
Highest: 24.75 (2015)

It has been a warm spring. It is nearly 2 standard deviations from the mean. It was abnormally warm spring. It is the eighth warmest spring for Upper Texas Coast. Here is the top 10 warmest spring in Texas since 1895.

Top 10 Warmest Spring In Upper Texas Coast
1.) 2012 72.83°F
2.) 2011 72.03°F
3.) 2006 72.00°F
4.) 2000 71.57°F
5.) 1967 71.43°F
6.) 1963 71.40°F
7.) 1908 71.37°F
8.) 2016 71.07°F
9.) 1991 71.00°F
10.) 1925 70.97°F

Spring 2012 was warm everywhere, especially up north. 2011 was very warm as well. Who could forget Summer 2011? It was Hell for sure, which was made worse by the drought. The warmth is due to abnormally warm low temperatures. All that heavy rain makes the air more humid. Humidity keepers temperatures from going too cold or hot. It is the seventh warmest low temperature for spring. Here is a divisional ranking map of low and high temperatures.

2016_SpringMinTemperatureDivisionalRanks

2016_SpringMaxTemperatureDivisionalRanks

It was very west for Upper Texas Coast. It exceeds 2 standard deviations, which makes a near outlier. In fact, it is the third wettest spring on record! Yes, third wettest. There have been two back to back wet springs in the Upper Texas Coast. Here is the top 10 wettest spring in Upper Texas Coast since 1895.

Top 10 Wettest Spring In Upper Texas Coast
1.) 2015 24.75
2.) 1997 22.18
3.) 2016 20.77
4.) 1900 19.54
5.) 1957 19.32
6.) 1929 19.06
7.) 1914 18.54
8.) 1944 18.33
9.) 1993 18.32
10.) 1905 17.60

Many of the wettest springs for Upper Texas Coast occurred when El Nino is developing (1914, 1957, 1997, and 2015), persistent (1905) or dying (1900). 1944 had a developing La Nina from Neutral. 1929 was Neutral. April and May 1929 had heavy rain that led to massive flooding in the Houston area. The 1929 flood is considered an epic flood on par with December 1935 and Tropical Storm Allison in 2001. It shows that El Nino does have an impact on spring rainfall,whether is strengthening or dying. Interesting to note hurricanes made hurricanes made landfall on Upper Texas Coast in 1900, 1929, and 1957. Two were major hurricanes, Galveston Hurricane and Audrey in 1957.

Could this be a harbinger of things to come? America has not seen a Category 3 or stronger hurricane since Wilma in 2005. Now, if we lowered Category 3 by 1 mph from 111 mph to 110 mph, than Ike would be a major hurricane. Even than, America has not seen a major hurricane make landfall since 2008, which is a long stretch. Keep in mind, hurricane re-analysis is happening, so this long stretch of no Category 3 or stronger hurricanes we are seeing may not be the longest.

Spring 2014 Report

Spring2014Ranks

Spring has passed as we approach summer as the days get longer. So, did winter choose to remain despite the fact the calendar says spring? Some areas were still cold and ice still prevailed in the Great Lakes. It was warm in the Western US as they are still languishing in a drought.

America
Temperature: 51.13°F
Rainfall: 8.01

1895-2014 Spring Statistics
Spring Temperature Mean: 51.06°F
Spring Temperature Median: 50.82°F
Standard Deviation: 1.36

Spring Rainfall Mean: 7.93
Spring Rainfall Median: 7.91
Standard Deviation: 0.97

America as a whole had a largely normal spring because of the stark contrast in temperature and rainfall. Some regions were cooler, while others were warmer. In terms of rain, some regions got more, while others got less. So that cancels each other out. This surface temperature anomaly map shows the eastern half of the US was cooler, while western half of the US was warmer. Most of the cold air was over Canada and Upper Midwest. Most of Arctic, Asia, and Europe had warmer than normal spring.

2014SpringSurfaceTemperatureAnomaly

One wonders why was the Eastern US cooler than the Western US this past spring. Look at a 500 millibar level geopotential height to look for anomalies. A positive anomaly is persistent ridging, while negative anomaly is persistent troughing. Here is a map of the 500 millibar level geopotential height anomaly map.

2014Spring500mbGeopotentialAnomaly

The North Atlantic Oscillation (NAO) is in a positive phase, as there is persistent troughing over Greenland and Northeastern Canada. A positive NAO usually means warmer than normal winter when NAO is positive. However, there is persistent ridging over Alaska. That area is called Nort Pacific Oscillation (NPO) or East Pacific Oscillation (EPO). When there is ridging over Alaska, the NPO/EPO is negative, while troughing over Alaska means positive NPO/EPO. The NPO/EPO is similar to NAO, but over the North Pacific Ocean. A negative NPO/EPO gives America a cooler than normal winter. It can have much influence than NAO, like this past winter, which was a cold one. Another cold winter where the NAO was positive, but NPO/EPO was negative is the winter of 1983-1984. That winter was really cold, especially December 1983.

Now, let’s look at the great state of Texas’s spring.

Texas
Temperature: 64.13°F
Rainfall: 6.12

1895-2014 Spring Statistics
Spring Temperature Mean: 64.75°F
Spring Temperature Median: 64.73°F
Standard Deviation: 1.77

Spring Rainfall Mean: 7.26
Spring Rainfall Median: 7.05
Standard Deviation: 2.16

Like America, Texas had a normal spring in terms of temperature and rainfall. The temperature is below average, but within average. Texas saw normal March rainfall as it got beneficial rains to put a dent on the drought. However, Texas needs more rain to end this drought, which will hopefully be case with El Nino. So, how did Houston area fared in Spring.

Upper Texas Coast
Temperature: 66.93°F
Rainfall: 11.12

1895-2014 Spring Statistics
Spring Temperature Mean: 68.50°F
Spring Temperature Median: 68.39°F
Standard Deviation: 1.68

Spring Rainfall Mean: 10.38
Spring Rainfall Median: 9.91
Standard Deviation: 4.28

It is not your imagination that Spring 2014 was cool in Southeast Texas. It was cooler than normal despite the fact that Texas and America had normal spring. The Upper Texas Coast cracked the top 20 coolest spring on record. It is even cooler than Spring 2013. Winter prevailed in Spring 2014 for Upper Texas Coast. This is despite the fact it is within the mean, but close enough to be outside the mean to be considered abnormal. Here is the top 20 coolest spring in the Upper Texas Coast.

Top 20 Coldest Spring
1.) 1931 63.37°F
2.) 1915 64.87°F
3.) 1926 65.53°F
4.) 1913 65.63°F
5.) 1983 65.67°F
6.) 1914/1969 65.87°F
7.) 1952 65.90°F
8.) 1924/1960 66.07°F
9.) 1941 66.40°F
10.) 1947 66.53°F
11.) 1970/1993 66.57°F
12.) 1912 66.60°F
13.) 1919 66.63°F
14.) 1917 66.67°F
15.) 1932 66.77°F
16.) 1942 66.83°F
17.) 1937 66.90°F
18.) 2014 66.93°F
19.) 1928/1962 67.03°F
20.) 1930 67.07°F

Spring 2014 is the 18th coolest spring on record since 1895! Spring 2013 is 22 coolest spring on record and ties with Spring 1901 as the average was 67.13°F. Interesting to note following a cool spring, a major hurricane has made landfall on the Upper Texas Coast in these years. Here are the correlation values between Spring Temperatures (March to May) and tropical landfall on the Upper Texas Coast.

Tropical Storm
r = 0.03
p = 0.71

Hurricane
r = 0.11
p = 0.22

Major Hurricane
r = -0.21
p = 0.02

All Landfall
r = 0.00
p = 0.99

There is a significant negative correlation between cool springs and major hurricanes making landfall on the Upper Texas Coast. Cooler the spring, the more likely a major hurricane is likely to make landfall. It is significant because the p-value below 0.05. Anything above 0.05 is not significant. Four of the top 20 coolest spring had a major hurricane make landfall during the hurricane season from June to November.

Major Hurricane
1915-Galveston Hurricane of 1915 (Category 3)
1932-Freeport Hurricane (Category 4)
1941-Hurricane #2 (Category 3, Based on Reanalysis)
1983-Alicia (Category 3)

Hurricanes
1947-Hurricane 3 (Category 1)

Interesting to note that San Antonio Spurs won the NBA Championship, a hurricane made landfall. Here are the championship years for Spurs and hurricanes that made landfall.

1999-Bret
2003-Claudette
2005-Rita
2007-Humberto
2014-?

Two are Category 3 or above, while the other two are Category 1. In Humberto’s case, had it stayed over the Gulf of Mexico longer, it easily would have been a Category 3 or above hurricane. Thankfully that never happened as it made landfall east of Galveston on September 13, 2007 at 2:00 AM. Eerily, exactly one year later on that day and time, a much larger hurricane, Hurricane Ike, made landfall on the eastern part of Galveston Island.

However, none of them had an El Nino developing that year. Most were either Neutral (2003) or going into La Nina (1999, 2005, and 2007). El Nino is forecasted to develop for this year and that reduces storm formation from westerly wind shear. However, during El Nino years, storms form closer to land and increase their chance for landfall. My spring forecast for the 2014 Atlantic Hurricane Season used years that saw El Nino developing early. Looking at it this 2014 analog GIS heat map, many of them end up in the Gulf of Mexico, particularly the Central and Western Gulf of Mexico.

2014AnalogHurricaneHeatMap

Notice the highest risk for storms to hit are the Central Gulf Coast region, which is Louisiana, Mississippi, and Alabama. Southeast Texas is also in a high risk area for landfall during an analog season where El Nino is developing. It proves that even a less active season is just as dangerous as an active season.

Drought Misery Index

With the ongoing drought, I came up with the Drought Misery Index (DMI), which is similar to the Misery Index for the economy. Here is the formula for Drought Misery Index.

Palmer Drought Severity Index (PDSI) + Precipitation (PCP) = Drought Misery Index

Example:
-8.00 + 1 = -7.00

The more negative the DMI, the worse the drought is. Here is the current DMI, based on September outcome.

America
-2.78
-4.78 (PDSI) + 2.00 (PCP)
Lowest: -6.01 August 1934
Highest: +9.91 May 1983

Texas
-2.49
-3.78 (PDSI) + 1.29 (PCP)
Lowest: -7.22 September 1956
Highest: +15.51 October 1919

Upper Texas Coast
0.38
-2.05 (PDSI) + 2.43 (PCP)
Lowest: -4.64 July 1925
Highest: +20.98 October 1949

All data is from the Division Data and it can change as more data is put in and averaged out.

2012-2013 Winter Report Progress Report

Winter2013Ranks

Meteorological Winter of 2012-2013 has passed into memory lane. Time flies fast as Christmas felt like yesterday and it is almost Easter. So, how did Winter 2012-2013 stack up?

America
Temperature: 34.36°F
Rainfall: 7.10

1895-2013 Winter Statistics
Winter Temperature Mean: 33.01°F
Standard Deviation: 1.99

Winter Rainfall Mean: 6.43
Standard Deviation: 0.88

America had the 24th warmest winter on record. Quite warm if you think about it. This winter was cooler as last winter. 2011-2012 Winter was the 5th warmest winter on record. A winter without much snowfall, which gave way to drought and warm year in 2012.

If there is a consolation prize for this winter, it was a wetter than normal winter on top of more snow. America had the 22nd wettest winter on record. That is an improvement from last winter, which had the 24th driest winter on record. It is rain that is needed to put a dent on the drought.

Texas
Temperature: 50.07°F
Rainfall: 4.93

1895-2013 Winter Statistics
Winter Temperature Mean: 47.97°F
Standard Deviation: 2.29

Winter Rainfall Mean: 5.10
Standard Deviation: 1.90

Texas had quite a warm winter as it was above the standard deviation. Texas had the 18th warmest winter on record, which puts it in the top 20 warmest winter from 1895 to 2013. The previous winter had the 35th warmest winter on record. 2011-2012 winter was cooler than the winter of 2012-2013.

Texas had the 55th wettest winter on record. Last winter, Texas had the 10th wettest winter on record. Quite a stark contrast if you think about it. A wet winter gives a cooler winter as there are cloud cover and moisture in the air that moderates the temperature. The rainfall amount is within the normal range as it is within standard deviation. Texas could use more rain to put an end to the drought plaguing Texas.

Upper Texas Coast
Temperature: 58.07°F
Rainfall: 11.45

1895-2013 Winter Statistics
Winter Temperature Mean: 55.12°F
Standard Deviation: 2.63

Winter Rainfall Mean: 10.72
Standard Deviation: 3.46

Upper Texas Coast had the 16th warmest winter on record. It was warm even by Southeast Texas standard, even though they have mild winters. Last winter, the Upper Texas Coast had the 18th warmest winter on record. Another warm winter for the record book and back to back, like in 1998-1999 and 1999-2000. The Ghost of Winter Past did not want to leave the Upper Texas Coast.

The Upper Texas Coast had the 42nd wettest winter on record. Last winter, Upper Texas Coast had the 14th wettest winter on record, which occurred in a La Nina winter. Upper Texas Coast is drier than last year. However, in terms of rainfall, Upper Texas Coast had a normal rainfall as it is within the standard deviation. It is still concerning as there has not been a lot of rain lately as Upper Texas Coast is seeing droughts developing.

2012-2013WinterAnalogWeatherOutcome

So, how did my winter forecast hold up? It held up for the most part. East of the Continental Divide had warmer than normal winters, while west of the Continental Divide and Hawaii were cooler. However, Alaska, Western Canada, and Northeastern Canada was warmer than normal. The analog winters of 1951-1952, 1963-1964, and 2001-2002 have Alaska, Western Canada, and Northeastern Canada cooler than normal. In terms of rainfall, it was much wetter in the Midwest, Great Lakes, Southern Alaska, and Western Canada than in the analog winters. It was much drier in the West Coast and Southeast.

2012-2013WinterAnalogOutcome500mbGeopotentialHeight

How was the upper level atmosphere like? For the most part it came close. The North Atlantic Oscillation (NAO) was positive as there is a upper level high pressure over Greenland. There is also upper level ridging over Northwest Africa. On the other hand, there were strong upper level trough over Russia and Central Europe.

I think my winter forecast held up well. I would give myself a A- as there are rooms for improvements. I base analogs on Pacific Decadal Oscillation (PDO), Atlantic Multidecadal Oscillation (AMO), and El Nino Southern Oscillation (ENSO). The reason I use PDO and AMO is that they are long term and change about every decade or so. ENSO changes every year, so one year could be La Nina, while the other year is El Nino. El Nino and La Nina have an impact on winter weather.

1951-1952, 1963-1964, and 2001-2002 had cool PDO, warm AMO, and neutral ENSO, which 2013 had. As for spring analogs, I am going to use the same analog winters, which are 1952, 1964, and 2002.

Summer 2012

Whew! The meteorological summer (June 1st to August 31st) is over and we are about to enter fall. Some areas were really hot and dry, while others were cooler and wetter. It depended on where you lived. The more north you are, the warmer and drier it was, while the more south you were, the cooler and wetter it was. 2012 Summer was a summer of contrast. So, how did Summer 2012 turn out?

Let’s start with America. All data is based on data from 1895 to 2012.
2012 Summer Average Temperature = 74.41°F
2012 Summer Rainfall Total = 7.39

Summer Average Temperature = 72.23°F
Summer Average Rainfall Total = 8.27

Let’s look at how 2012 ranks for America.

Temperature Ranking
1.) 1936 74.64°F
2.) 2011 74.49°F
3.) 2012 74.41°F
4.) 2006 74.36°F
5.) 1934 74.18°F

2012 is the third warmest summer on record in America from 1895 to 2012. It is way above standard deviation of 0.99 from the average, which is 72.23°F. Summer 2012 is 2.18°F above normal, which way above the standard deviation. Only 1936 and last summer was warmer. Not as hot like last summer, but hot nonetheless. It was very warm, especially in the Midwest, where there is a severe drought. What did Summer 2012 yield in the rainfall department.

Rainfall Ranking
1.) 1930 6.03
2.) 1936 6.34
3.) 1980 6.82
4.) 1934/1954 6.88
5.) 1988 6.89

Summer 2012 is the 17th driest summer on record. It is not in the top 5 driest summer on record. It below standard deviation of 0.77. Interesting to note that the top 5 driest springs occurred in the 1930s and 1980s. The 1930s had the Dust Bowl, the worst drought to strike America in centuries. It was during the Great Depression and no doubt the drought played a role in it. It shows warmer the summer is, the drier it is. Drought is perpetuating in nature.

Now, let’s look at Texas.
2012 Summer Average Temperature = 83.07°F
2012 Summer Rainfall Total = 6.71

Summer Average Temperature = 81.45
Summer Average Rainfall Total = 7.72

Let’s look at how 2012 ranks for Texas.

Temperature Ranking
1.) 2011 86.67°F
2.) 1980/1998 84.27°F
3.) 1934 84.20°F
4.) 1918 83.47°F
5.) 1953/1954 83.37°F

Summer 2012 is the 8th warmest summer on record for Texas. It is way above standard deviation of 1.35. Still in the top 10 warmest summer on record, but cooler than Summer 2011. That was hot right there! The warmest summers occur in drought years, so no surprise again. How does Summer 2012 compare from previous summers in Texas.

Rainfall Ranking
1.) 2011 2.48
2.) 1956 3.48
3.) 1934 3.73
4.) 1952 3.84
5.) 1954 3.95

Texas had 39th driest summer on record. That is an improvement from last summer, which was extremely dry. Summer 2012 was withing standard deviation of 2.20. We could still use more rain as most of Texas is still marred by the drought. Since we are heading into an El Nino, it will be most likely wetter for Texas. That would be a good thing as El Nino is typically wet for Texas. The driest summers occurred in the 1950s, during the horrible drought of the 1950s.

Now, let’s move onto to the Upper Texas Coast.
2012 Summer Average Temperature = 83.13°F
2012 Summer Rainfall Total = 16.13

Summer Average Temperature = 82.63°F
Summer Average Rainfall Total = 13.07

Temperature Ranking
1.) 2011 85.97°F
2.) 1998 85.10°F
3.) 2009 84.73°F
4.) 2010 84.40°F
5.) 1958 84.27°F

Upper Texas Coast had the 24th warmest summer on record. That is dramatic from last summer, which was the hottest on record. Summer 2012 was within the standard deviation of 0.92, so it was a normal summer. Indeed, this summer was cooler than normal. It was warm nonetheless due to the unusually warm low temperatures at night. Was Upper Texas Coast wetter or drier in Summer 2012?

Rainfall Ranking
1.) 2009 5.66
2.) 1924 5.79
3.) 1980 5.87
4.) 2000 5.89
5.) 1954 6.18

Upper Texas Coast saw a huge improvement in summer rainfall, especially with July being quite wet. Summer 2012 is the 30th wettest summer on record. The summer rainfall total was within standard deviation of 4.90, which is normal. Not bad. Last summer was the 8th driest summer on record. The drought for the Upper Texas Coast is over. However, I am hesitant to declare this drought over as most of Texas is still in a drought.

11 years ago tonight, everyone was looking forward to a new day, which was Tuesday, September 11, 2001. That day would be a very tragic day and week. The whole world watched the horrific terrorist attacks unfold on live television and the 4 day never ending news coverage. That tragic day would change America and world.

How Bad Is This Drought?

It has not rained much in Southeast Texas. In fact, we have not seen over 1 inches of rain since January and it has been 4 months in a row that the Upper Texas Coast has seen less than 1 inch per a month. In fact, October to May rainfall total is the driest on record as shown on the list of top 10 driest October to May rainfall total in the Upper Texas Coast.

1.) 2010-2011 14.17
2.) 1924-1925 15.20
3.) 1955-1956 16.60
4.) 1908-1909 16.74
5.) 1950-1951 17.36
6.) 1916-1917 17.90
7.) 1917-1918 17.92
8.) 1901-1902 18.10
9.) 1939-1940 18.67
10.) 1962-1963 19.26

However, when it comes to Palmer Drought Severity Index (PDSI), it is not the worst. PDSI uses uses temperature and rainfall information in a formula to determine dryness. 0 is considered normal, while negative value is drier, while positive value is wetter. Here is the list of lowest or worst PDSI for Upper Texas Coast.

1.) 1917-1918 -4.86
2.) 1924-1925 -3.85
3.) 1955-1956 -3.68
4.) 1999-2000 -3.57
5.) 1954-1955 -3.37
6.) 1916-1917 -3.30
7.) 1950-1951 -2.98
8.) 2005-2006 -2.93
9.) 1951-1952 -2.90
10.) 1915-1916 -2.87

The drought of 1917-1918 is the worst even to this very day. It is legendary in its own right. The 1950s was the longest drought in Texas as it lasted for 7 years. October 2005 to May 2006 has a lower PDSI than right now. The winter of 2005-2006 was abnormally warm, which would have a more negative PDSI. The PDSI for October 2010 to May 2011 in the Upper Texas Coast is -1.54, which is serious. To compound it, there are more people living in Texas today than in the late 1910s and 1950s. More people use water for drinking, farming, and watering their yards. It is going to worsen the drought as water supplies are becoming more strained.

If we do not see rain any time soon this summer, the drought will only get worse and easily be in the top 10 worst droughts for Upper Texas Coast in terms of PDSI. Also, if it is dry, it will get hotter as drier grounds is more favorable for heat. Moisture moderates air temperature. It is no surprise that wetter years are cooler than compared to drier years, which are warmer.

Here is a chart of Upper Texas Coast October to May PDSI from 1895 to 2011.

Here is a chart of Upper Texas Coast October to May rainfall total from 1895 to now.

It shows that droughts come and go. It is cyclical in nature. Here is the top 10 highest October to May PDSI for Upper Texas Coast.

1.) 1919-1920 4.35
2.) 1991-1992 3.94
3.) 1941-1942 3.60
4.) 1973-1974 3.47
5.) 1992-1993 3.47
6.) 1913-1914 3.35
7.) 1979-1980 2.96
8.) 1960-1961 2.85
9.) 2006-2007 2.71
10.) 1923-1924 2.41

Top 10 wettest October to May rainfall for Upper Texas Coast.

1.) 1991-1992 46.97
2.) 1940-1941 45.29
3.) 1913-1914 44.01
4.) 1994-1995 43.40
5.) 1925-1926 42.79
6.) 1943-1944 42.41
7.) 1949-1950 42.41
8.) 1992-1993 42.26
9.) 2006-2007 42.23
10.) 1990-1991 41.82

Some of the highest PDSI and rainfall came after droughts, so there is hope in the end. I do remember the early 1990s being very wet.

Here is a NCDC of May droughts for all of Texas.

The current drought for all of Texas is one of the worst droughts in history, along side with 1918 and 1956. If Texas does not get rain, it will be a serious problem for everyone.

As for why we have a drought, it is because of La Nina cycle of El Nino Southern Oscilliation (ENSO). This past October to May was La Nina. La Nina is the opposite of El Nino, in which the Pacific Ocean water off the coast of South America is cooler than normal. The cooler water pushes the jet stream further north, which causes storm systems to go further north than usual. That means all the energy is further away from Texas. In an El Nino, the jet stream is further south, which means storm travel further south than normal, which means a wetter year. Some of the wettest years happened in El Nino years. The correlation between La Nina and rainfall and PDSI is strong.


Pearson Correlation
r = 0.41
p-value = < 0.01


Pearson Correlation
r = 0.42
p-value = < 0.01

The correlation value and p-value are strong, so there is a significant relationship between ENSO and PDSI and rainfall.

Data Source
NOAA-Divisional Data

El Nino/La Nina Data
FSU-Japan Meteorological Agency ENSO SST

Spring 2011

If you thought spring was really warm and dry. You are right, it was warm and dry. Here is the outcome for Spring, which is from March to May for the Upper Texas Coast.

Temperature
71.8°F

1895-2011 Spring Temperature
Mean
69.2°F

Median
69.1°F

Standard Deviation
1.6

Percentile
5th
67°F

25th
68.2°F

50th
69.1°F

75th
70.5°F

95th
71.5°F

Spring 2001 temperature is 2.6°F above normal, which is abnormally warm. Spring 2011 is the fifth warmest spring on record, going back to 1895. Here is where Spring 2011 temperature ranks.
1.) 1908 72.3667°F
2.) 1967 72.2000°F
3.) 1963 72.1667°F
4.) 2006 72.0333°F
5.) 2011 71.8000°F
6.) 1929 71.7000°F
7.) 1953 71.4333°F
8.) 1991 71.4333°F
9.) 1927 71.4000°F
10.)2000 71.4000°F

Rainfall Total
2.87 Inches of Rain

1895-2011 Spring Rainfall
Mean
10.66

Median
10.17

Standard Deviation
4.49

Percentile
5th
4.32

25th
7.16

50th
10.17

75th
13.25

95th
19.00

Spring 2001 rainfall is 7.79 inches below normal. Spring 2011 is the second driest on record for the Upper Texas Coast. Here is where Spring 2011 rainfall total ranks.
1.) 2003 2.56
2.) 2011 2.87
3.) 1963 2.91
4.) 1996 3.13
5.) 1978 3.26
6.) 1998 3.32
7.) 1960 4.57
8.) 1899 5.02
9.) 1958 5.30
10.)1961 5.33

What does summer rainfall hold? There is no correlation between spring and summer rainfall total as shown in this scatter chart.

Here is the correlation value from 1895 to 2010.
r = 0.02
p-value = 0.82

There is no correlation between spring and summer rain. It could either be wet or dry summer. Interesting to note that some of the driest spring on record gave way to really wet summers. Here are summer totals following dry springs.
1.) 2003 16.91
2.) 2011 NA
3.) 1963 9.87
4.) 1996 18.4
5.) 1978 12.14
6.) 1998 11.13
7.) 1960 24.46*
8.) 1899 15.09
9.) 1958 7.87
10.)1961 23.06*

*Top 10 Wettest Summer

Some of the wettest summers on record for Upper Texas Coast occurred after a dry spring, 1960 and 1961 had wet summers in the top 10 wettest summers on record. So, not all is lost. Perhaps, we could see a wet summer. So there is hope that summer could be wet. As they say in Texas, droughts end in floods. Let’s see what happened following dry springs.
2003 Hurricane Claudette and Tropical Storm Grace make landfall.
1963 Hurricane Cindy makes landfall in East Texas. Dumps up to 23.5 inches of rain in Deweyville, Texas.
1996 Heavy rain falls in August from the outer bands of Hurricane Dolly.
1978 Hurricane Debra makes landfall in Cameron Parish, Louisiana.
1998 Tropical Storm Charley and Frances make landfall on Upper Texas Coast. Charley dumps 4 to 6 inches of rain, while Frances dumps up to 20 inches of rain.
1960 Tropical Storm #1 makes landfall in South Texas. Up to 30 inches of rain falls in Port Lavaca, Texas.
1899 A massive flood plagues the Brazos River Valley from June 27 to July 1.
1958 None
1961 Hurricane Carla makes landfall around Port Lavaca.

Here are the top 10 wettest summer for the Upper Texas Coast.
1.) 1960 24.46
2.) 1981 24.06
3.) 2007 24.01
4.) 2001 23.16
5.) 1942 23.10
6.) 1961 23.06
7.) 1919 22.82
8.) 1983 21.93
9.) 1945 21.66
10.) 1973 21.49

Source
NOAA Divisional Weather

Why Texas Is So Dry Part 2

It has been really dry lately in Texas. The reason it is dry is that we are in La Nina, which pushes the jet stream further north than usual. It causes storm systems to go further north, which means it allows warm air aloft above the surface to develop unchecked. The warm air aloft is from the deserts of Mexico. The warm air aloft is always there, but it is kept in check by storms systems that destroys them. Another reason why Texas is so dry is the upper level is drier than normal. It could be really humid on the ground, but go 5,000 feet (1,524 meters), it is much drier. The dry upper atmosphere is again from the dry and warm air of Mexican deserts. In wet years, the upper part of the atmosphere is wetter than normal. I am going to be comparing two springs from March to May. The wettest spring on record for Upper Texas Coast is 1997 and current spring, which is likely going to be one of the driest spring on record.

Spring 1997 Relative Humidity Anomaly

Spring 2011 Relative Humidity Anomaly

Notice anything? Spring 1997 was unusually humid at the surface and at the 5,000 feet (1,524 meters or 850 millibar) level. Spring 2011 humidity level is within average. However, at 5,000 feet, it is dry. The surface can be very humid, but when you go 5,000 feet (1,524 meters), it is much drier. The low relative humidity at the upper levels inhibit storms from forming. The low moisture level is what kills storms from forming over eastern part of Texas.

If you think Texas is in a drought and abnormally warm, we are not alone. Europe is also in midst of a severe drought and abnormal warmth for the same reason Texas is in, La Nina. Texas and Europe’s drought are one of the worst on record.

Spring 2011 Relative Humidity Anomaly In Europe

The level of moisture at the surface and 5,000 feet (1,524 meters) is abnormally dry.

Spring 2011 Air Temperature Anomaly In Europe

Europe is abnormally warm at the surface and 5,000 feet (1,524 meters).

Spring 2011 Geopotential Height Anomaly In Europe

There is a blocking feature over Europe at the 18,000 feet (5,487 meters). That upper level high pressure is blocking any storm systems that give Europe rain.

The same atmospheric setup in Europe is very similar to in Texas, low moisture, warmer temperature, and upper level block pattern.