It is this time again. Winter is here and Christmas is coming. Christmas comes sooner and sooner every year. I cannot believe that 2010’s is about to enter memory lane as we enter the 2020s. 2000 felt like yesterday as we feared Y2K bug, but nothing serious happened. The new Millennium start in 2001. In many ways, the new Millennium started on September 11, 2001 when Al-Qaeda terrorists flew into the World Trade Center, Pentagon, and near Shanksville claiming 3,000 lives.
We currently have a warm neutral equatorial Pacific. It is hard to say if El Nino is developing or not. However, the water off the coast of Alaska is very warm, which is a factor I have taken into account. It is dubbed “The Blob” or I call it the Northeast Pacific Warm Pool. What will the Winter of 2019-2020 be like? I will start with winters that have warm neutral equatorial Pacific.
1880-1881
1883-1884
1884-1885
1885-1886
1891-1892
1895-1896
1900-1901
1919-1920
1923-1924
1946-1947
1952-1953
1953-1954
1958-1959
1978-1979
1989-1990
1990-1991
1993-1994
2003-2004
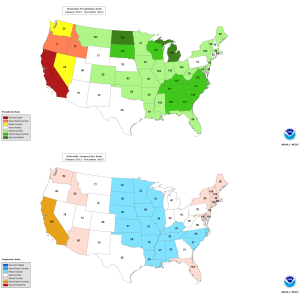
Here is a map of the most recent sea surface temperature anomaly. It is as of 12/23/2019.

Here is annotated version.

I will also look at the ocean temperature as they are factors besides El Nino. This will help narrow it down to which winter analogs they are. They are Tripole Index for the Interdecadal Pacific Oscillation (TPI IPO), Pacific Decadal Oscillation (PDO), Atlantic Multidecadal Oscillation (AMO), Northeast Pacific Warm Pool (NEPWP), Equatorial Indian Ocean (EIOI), Roaring Forties (R40I)/Southern Ocean, and Quasi-Biennial Oscillation (QBO). The rest that are not linked, please click on Climate Indices. Not all El Nino winters are the same.
Here is the chart of analogs.
| Year | ENSO | TPI IPO | PDO | AMO | NEPWP | EIOI | DMI | R40I | QBO | Total | Note |
| 1880-1881 | 1 | 1 | 1 | 1 | 4 | No QBO Data | |||||
| 1883-1884 | 1 | 1 | 1 | 1 | 4 | No QBO Data | |||||
| 1884-1885 | 1 | 1 | 1 | 1 | 4 | No QBO Data | |||||
| 1885-1886 | 1 | 1 | 1 | 3 | No QBO Data | ||||||
| 1891-1892 | 1 | 1 | 1 | 3 | No QBO Data | ||||||
| 1895-1896 | 1 | 1 | 1 | 3 | No QBO Data | ||||||
| 1900-1901 | 1 | 1 | 2 | No QBO Data | |||||||
| 1919-1920 | 1 | 1 | 2 | No QBO Data | |||||||
| 1923-1924 | 1 | 1 | 2 | No QBO Data | |||||||
| 1946-1947 | 1 | 1 | 1 | 1 | 4 | No QBO Data | |||||
| 1952-1953 | 1 | 1 | 1 | 1 | 4 | ||||||
| 1953-1954 | 1 | 1 | 1 | 3 | |||||||
| 1958-1959 | 1 | 1 | 1 | 3 | |||||||
| 1978-1979 | 1 | 1 | 1 | 1 | 1 | 1 | 6 | ||||
| 1989-1990 | 1 | 1 | 1 | 1 | 1 | 1 | 1 | 7 | |||
| 1990-1991 | 1 | 1 | 1 | 1 | 1 | 1 | 1 | 1 | 8 | ||
| 1993-1994 | 1 | 1 | 1 | 1 | 1 | 1 | 6 | ||||
| 2003-2004 | 1 | 1 | 1 | 1 | 1 | 5 |
I narrow down to these analog winters.
1978-1979
1989-1990
1990-1991
1993-1994
2003-2004
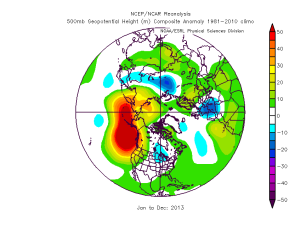
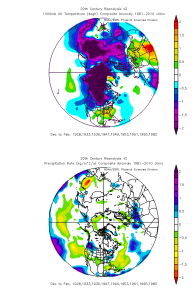
I will use those winters for the analog winter forecast. Let’s look at the upper air pattern at the 500 millibar level or 18,000 feet. All the maps are from 20th Century Reanalysis Monthly Composites.

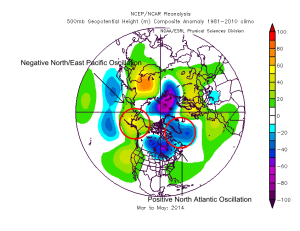
There is ridging south of Alaska, Arctic Ocean, and Greenland. The ridging over Gulf Of Alaska and Far East Russia are negative East Pacific Oscillation (EPO) and West Pacific Oscillation (WPO). They are the North Pacific equivalent of North Atlantic Oscillation (NAO). Ridging over Greenland is a negative NAO. A negative NAO, EPO, and WPO are more favorable for cold winters. The ridging allows cold air to be shunted southward. The areas under the ridging are warmer as a result. All the cold air went to a different area.
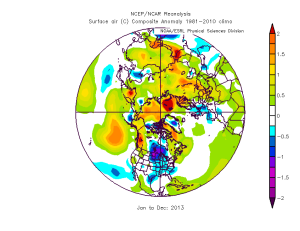
What will the temperature be like at the surface?

Most of North America and Siberia are cold. Southeast Texas winter temperature is not abnormally cold or warm, but within average. Regardless, this suggests this winter could be a cold one. Greenland, Mongolia, and Korea are warmer than normal, but not overtly warm.
Let’s look at temperature at 850 millibars or 5,000 feet.

The air is cold at 5,000 feet over Canada and Siberia. It is not abnormally cold over Texas. The reason I am including this is if is freezing cold above the surface, it increases the chance for snow in the winter. One can have freezing cold at the surface, but warm above ground. That leads to freezing rain or sleet. For snow to form, the upper atmosphere needs to be cold. Snowfall occurs if the surface is not cold because the atmosphere is freezing. It is above that counts. Often when it snows, the surface is not really that cold.
Lastly, let’s look at precipitation rate.

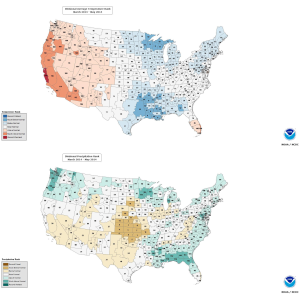
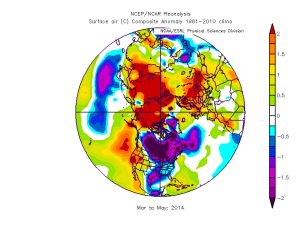
The Western US looks to be dry. The wettest looks to be around Hawaii, Southeastern US, and Western Europe. Houston area could see a wetter than normal winter, but not overtly wet winter. The last time the Northeast Pacific Warm Pool was warm was in 2013-2014. There a severe drought that plagued California. The warm Northeast Pacific Warm Pool contributed to the Ridiculously Resilient Ridge.
How were winters like in these analog years?
1978-1979
Coldest winter recorded in America. The late 1970s and just the 1970s was cold in general. It was cold all over the Lower 48.
1989-1990
The winter to remember with December 1989 freeze. Many areas set record lows, which are yet to be broken as of 2019. Houston saw a low of 7°F on December 22, 1989! Houston has seen single digit temperatures in February 1899 twice and January 1930. Houston presumably had single digits in January 1886. The epic freeze affected east of the Rocky Mountains. After the cold blast, winter was mild throughout America. The December 1989 freeze ranks up there with January 1886, February 1895, February 1899, and December 1983.
1990-1991
Almost a year after the epic December 1989 freeze, America sees another freeze. It mainly affects the Western US. It is one of the worst freeze for California. Houston area sees another freeze. Western Europe had a cold winter, particularly United Kingdom. Many areas in Europe saw heavy snow.
1993-1994
The cold blast on January 1994 that affected the Eastern US. Houston saw snow in February 1994. There was an ice storm in February 1994.
2003-2004
The December 2003 Nor’easter that dumped heavy snow throughout the Northeastern US. It is one of the largest early season Nor’easter. Another Nor’easter dubbed White Juan ravages the Eastern US and Maritime Provinces of Canada in February 2004. It dumped heavy snow of up to 40 inches.
What these winters have in common is there was a huge cold blast. Also, the winters are among the coldest on record. Does this mean we will see another December 1989 freeze this winter or a warm winter after the December 1989 cold blast? No, but we could see a cold blast or warm winter this winter.
I think this winter is looking to be a cold winter. I would not be surprised to hear of a major cold blast this coming winter or snow fall. I could see major winter storms happening on top potent cold waves.